Oil Production For Wyoming Case Study Solution
Empirical Model
The empirical models in this study are used to analyze the data through regression analysis. This analysis has been performed to show the kind of relationship that exists between different variables. In order to analyze the correlation between different variables, regression analysis is found to be very authentic, and it provides strong evidences based on the data available. The following relation has been developed and analyzed.
- Relationship of GDP with Crude Oil Prices. (US Dollars per Barrel)
- Relationship of GDP with Oil Production for Wyoming.
- Relationship of GDP and Wyoming Population.
- Relationship of Wyoming Population and Oil Production.
- Relationship between Crude Oil Prices (US Dollars per Barrel) and Oil Production for Wyoming.
Empirical Results
Table4.1: Regression between GDP and Crude Oil Prices (US Dollars per Barrel)
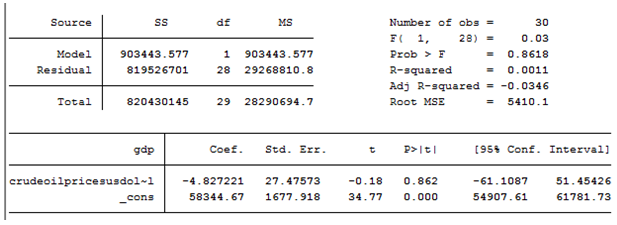
Table 4.1 shows a negative relationship between the variables, for every dollar increase in the crude oil price, the GDP of Wyoming decreases by $4.8.
Table 4.2: Regression between GDP and Oil Production for US
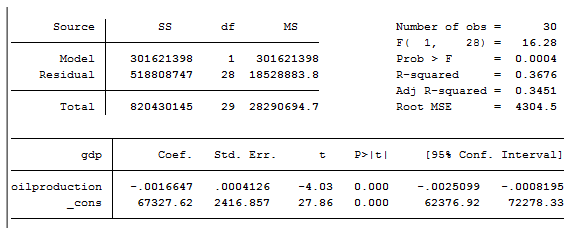
Table 4.2 shows that a negative relation exists between both the variables, which mean that they are not correlated to each other.
Table 4.3: Regression between GDP and Wyoming Population
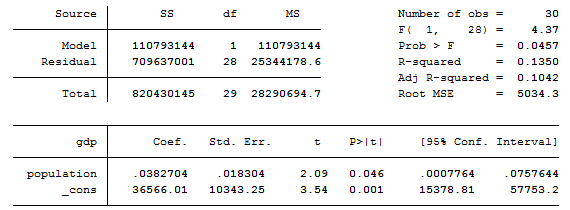
Table 4.3 shows that a weak positive relation exists between both the variables, which mean that they are weakly correlated to each other.
Table 4.4: Regression between Wyoming Population and Oil Production
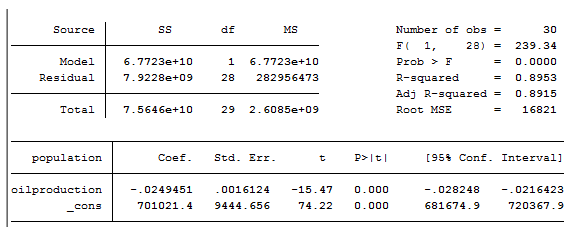
Table 4.4 shows that a negative relation exists between both the variables, which mean that they are not correlated to each other.
Table 4.5: Regression between Crude Oil Prices (US Dollars per Barrel) and Oil Production for Wyoming
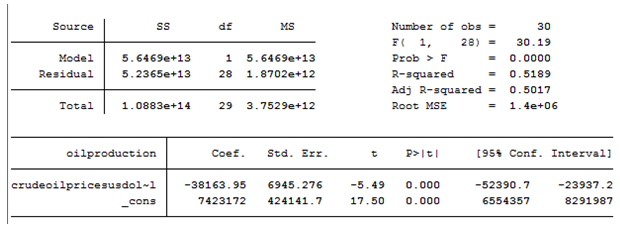
Table 4.5 shows that a negative relation exists between both the variables, which mean that they are not correlated to each other.
Table 4.6: Regression between Oil productions, Crude Oil Prices (US Dollars per Barrel), GDP and US Population
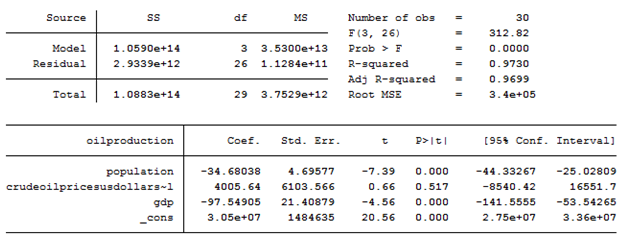
The regression equation for oil production is
Oil production = 3.05 - 34.68 (Population) + 4005.64 (Crude oil prices) - 97.55 (GDP)
In this equation the oil production is dependent variable where all other variables are the explanatory variables that is effecting the oil production in the United States. Here constant 3.05 shows that when all variables are equal to zero than the oil production in United States will be 3.05 barrels.
Conclusions
After analyzing the whole data; it has been found that only GDP has positive relationship with the population, since an increase in the population positively contributes in the GDP of the state. All other variables have a negative relationship with the GDP, which are in line with the general statistics, since population is increasing with a small margin, whereas the GDP is growing more with an ever decreasing production of crude oil. Hence it can be concluded that increase in oil prices with a decrease in the production of crude oil does not positively contribute towards the GDP of the state, whereas increase in the population contributes positively towards the GDP of the state.
Exhibit:
Data Details
| Year | GDP | Crude Oil Prices (US Dollars per Barrel) | Oil Production | Population |
| 1987 | 46585 | 19 | 9871000 | 489451 |
| 1988 | 47652 | 16 | 9102000 | 490787 |
| 1989 | 49380 | 20 | 8970000 | 491780 |
| 1990 | 50814 | 24 | 8551000 | 494300 |
| 1991 | 53656 | 22 | 8472000 | 494657 |
| 1992 | 53921 | 21 | 7866000 | 500017 |
| 1993 | 54930 | 18 | 7301000 | 503453 |
| 1994 | 55848 | 17 | 6470000 | 509106 |
| 1995 | 57642 | 18 | 6503000 | 514157 |
| 1996 | 63428 | 22 | 6330000 | 522667 |
| 1997 | 65471 | 21 | 5939000 | 534876 |
| 1998 | 69182 | 14 | 5263000 | 546043 |
| 1999 | 66320 | 19 | 5042000 | 559851 |
| 2000 | 64603 | 30 | 5056000 | 564513 |
| 2001 | 63985 | 26 | 4760000 | 567725 |
| 2002 | 60777 | 26 | 4620000 | 576765 |
| 2003 | 60770 | 31 | 4407000 | 582684 |
| 2004 | 61417 | 41 | 4407000 | 583642 |
| 2005 | 60908 | 56 | 4365000 | 586555 |
| 2006 | 58821 | 66 | 4609000 | 585501 |
| 2007 | 59406 | 66 | 4242643 | 596850 |
| 2008 | 59029 | 72 | 4150286 | 601703 |
| 2009 | 58652 | 79 | 4057929 | 606555 |
| 2010 | 58274 | 86 | 3965571 | 611408 |
| 2011 | 57897 | 92 | 3873214 | 616261 |
| 2012 | 57519 | 99 | 3780857 | 621113 |
| 2013 | 57142 | 105 | 3688500 | 625966 |
| 2014 | 56765 | 112 | 3596143 | 630819 |
| 2015 | 56387 | 118 | 3503786 | 635671 |
| 2016 | 56010 | 125 | 3411429 | 640524 |
This is just a sample partical work. Please place the order on the website to get your own originally done case solution.
Related Case Solutions & Analyses:
 How to Better Frame Problems
 Oral Rehydration Therapy
 Note On Women And Power
 British Motorcycle Industry at a Crossroads
 The William Caspar Graustein Memorial Fund: Catalyzing Networks and Collaboration
 Governance at Metallgesellschaft (A)
 HP NANOTECH: PARTNERSHIP WITH CNSI


