Week 5 Final Paper Case Study Solution
Introduction
During the entire course, we have applied a variety of the statistical methods and now in this final paper we provide a detailed reflection about what we have learned during the class. The purpose of this report is to apply the 10 important elements of this course to real life scenarios and make use of the real life applications to generate the results and then interpret and discuss them within this report. The ten course elements that we would be applying in this report and reflecting upon are listed below:
- Probability
- Distribution
- Uncertainty
- Sampling
- Statistical Inference
- Regression Analysis
- Time Series
- Forecasting Methods
- Optimization
- Decision Tree Modeling
We reflect upon all the above 10 core elements and then discuss the results and interpret them within this report.
Week 1 - Add Inn/ Scatter Plots/ Correlations
Q1:Do the students’ scores for the two exams tend to go together, so that those who do poorly on the midterm tend to do poorly on the final, and those who do well on the midterm tend to do well on the final?
The attached scatter point shows two coordinates, the Y-axis as the final exam score and the X-axis as the midterm score. I have added a trend line to show the Y-axis uphill pattern, which indicates a positive trend in exam scores. This means that the student’s scores do tend to go together or those that do well on the midterm will do well on the final and those that do poorly on the midterm will do poorly on the final.
Q2: Based on this equation, what would you expect a student with a 75 on the midterm to score on the final exam?
The trend shows that a student’s score will go up; based on the line equation and the midterm score of 75 this student’s final exam score would be 75.6829 as shown below:
Y=0.997(75) +0.9079
Y=75.6829
Week 2 – Probability/ Distribution/ Simulation
a). Use simulation to generate 500 values of this random variable X.
Simulation has been used in the excel spreadsheet to generate 500 values of the random variable X.
b). Calculate the mean and standard deviation of the simulated values. How do they compare to the mean and standard deviation of the given probability distribution? (Albright, 2017, p. 159).
The mean and standard deviation of the given probability distribution is 0.091 and 0.148 respectively and the mean and standard deviation of the simulated values are higher at 0.23 and 0.043 respectively. There has been a significant increase in the mean probability and significant decrease in standard deviation of the probability for X.
Week 2 – Uncertainty
a). Develop a decision tree that can be used to solve Chang’s problem. You can assume in this part of the problem that she is using EMV (of her net profit) as a decision criterion. Build the tree so that she can enter any values for p1, p2, and p3 (in input cells) and automatically see her optimal EMV and optimal strategy from the tree.
The decision tree for Chang’s Problem is shown below:
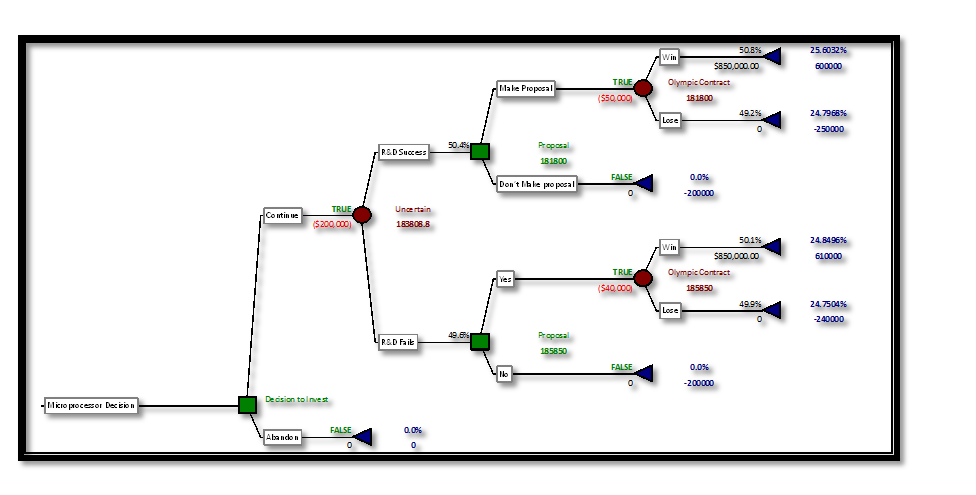
b). If p2 5 0.8 and p3 5 0.1, what value of p1 makes Chang indifferent between abandoning the project and going ahead with it?
Using the risk profile from Precision Tree to create a probability chart from the decision to invest (P1) you can see the potential value of loss if Chang does not get the contract. The value of p1 on #1 optimal path is the potential loss of 25% or $250,000 #2 optimal paths is 25% or 240,000. However, both have a good potential 26% &25% net gain.
c).How much would Chang benefit if she knew that the Olympic organization would guarantee her the contract. (This guarantee would be in force only if she were successful in developing the product.) Assume p1 5 0.4, p2 5 0.8, and p3 5 0.1
Using the policy suggestion from Precision Tree and creating a decision table you can identify the benefit of Changes correct choice. 183808.8 is the weighted average benefit of following the optimal strategy.
d). Suppose now that this is a relatively big project for Chang. Therefore, she decides to use expected utility as her criterion, with an exponential utility function. Using some trial and error, see which risk tolerance changes her initial decision from “go ahead” to “abandon” when p1 50.4, p2 50.8, and p3 50.1.
Using the utility function from precision tree, you can see the probability of the different risk tolerance that influence Chang’s decision to go ahead or abandon the project. The optimal path currently has a risk tolerance of $250,000 however, when you use the utility function it changes the path and suggests abandoning the project would be a better decision. Using the utility function, I entered five values of risk tolerance and found that $450,000 was the risk tolerance needed to continue with the optimal path.
Week 3 – Sampling
Q1: Provide an example of when you might want to take a cluster random sample instead of a simple random sample.
The big difference that I see between the two samples is that in the simple random sample every member of the population has the same chance of being selected (Albright, 2017, p. 282). However, in the cluster, random sample the population is separated into clusters and then a random sample of the cluster is selected (Albright, 2017, p. 289).
An opportunity such as running for an office would require using a cluster random sample over a simple random sample because of its ability to select information from special interest groups. If I were running for office, I would want to know what the special interest groups think of me as a candidate; that way I could adjust my goals, agenda or plans to make sure I could meet the needs of these special interest groups. Special interest groups pull votes; there is no way to effectively sample the whole population of all special interest groups, therefore, I would use a cluster random sample to collect this information.....................
This is just a sample partial case solution. Please place the order on the website to order your own originally done case solution.
Related Case Solutions & Analyses:
 Lac Leman Festival de la Musique (B)
 Collaborating to Improve
 International Paper: Longwood Woodyard Plant
 Privatization of Anatolia National Telekom: CORConfidential Instructions
 NHL–1998: The Coolest Game in Nagano
 Contribution to Capital
 Negotiating Peace Accords in Bellicoso for UN Negotiating Team Representatives: General Instructions and Confidential Information
 Tottenham Football Club Plc
 Etheryl (B): From Etheryl to Appsfire


