Quality of Data Analysis
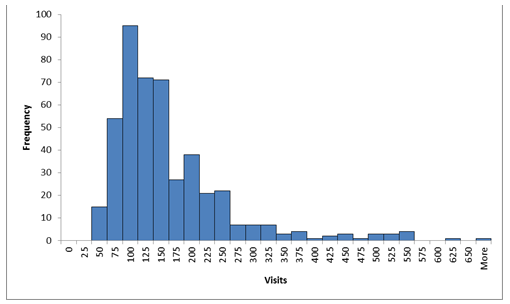
The descriptive statistics reveal that the QA website saw 150 daily visits from the period of MAY 25, 2008–AUGUST 29, 2009. Therefore, it can be said that the company had over 54 thousand visitors over the course of one year. The standard deviation of 98 shows that there is high variability in the day to day visitors. A high std. deviation indicates that the number of daily visits are scattered away from the average daily visits. The data with higher variability will make it difficult for the QA Inc. to predict the future trend of daily visits. (Roberts, n.d.).Further favouring high variability is at times the maximum number of visitors were as high as 627 per day, but there were occasions when the daily visits went as low as just 37 per day. This signifies the fact that the website has seen varying number of visitors over a year. The descriptive stats in exhibit 2 shows the details of the data. After analysing the histogram, it is seen that the data for daily visitors followed a non-normal distribution. The skewness of greater than zero reveals that the data is non symmetrical which can also be seen in histogram in exhibit 2. With this, as the kurtosis of 5.26 is greater than zero, it means that the data is leptokurtic distributed and has heavier tails.(McNeese, 2008 )The graph tells us that the QA website had 75 to 100 visits per day for around 100 days a year. But the higher number of visits weren’t repeated at a rapid pace. The non-symmetric of data might create problems for the firm as to predict for the future number of visits.
Recommendations
QA Inc. wants to come out from the traditional style of marketing and has developed their own website to gather larger orders from old and newer customers. The data reveals that the company has seen a high variability in number of website visits from May, 2008 to August 2009. The overall average of 150 daily visits doesn’t give the clear picture as the data is non-symmetrical and website saw daily visits of 75-100 visits per day in majority of days throughout the year. Though, at an odd day the website also witnessed over 600 visitors.
It is recommended that the company must have data of more than a year to have a much clear picture. Apart from this, the company must have the data of daily visits against the date. Like this it would be possible for the firm that which particular day saw low daily visits and on which date there were higher number of visitors. By doing this, they would know what they should do to boost the number of visits. Furthermore, the company should use different strategies to attract greater number of visitors per day. They could also enhance the company’s digital marketing department so that more customers could flock to the website.
Exhibits
Exhibit 1
Visits |
|
| Mean | 150.2835498 |
| Standard Error | 4.567258109 |
| Median | 122 |
| Mode | 91 |
| Standard | 98.16949192 |
| Sample Variance | 9637.249143 |
| Kurtosis | 5.861989632 |
| Skewness | 2.166972212 |
| Range | 627 |
| Minimum | 37 |
| Maximum | 664 |
| Sum | 69431 |
| Count | 462 |
Exhibit 2
Histogram of daily visits