The Procter & Gamble Company: Investment in Crest White strips Advanced Seal Case Study Solution
Analysis and Evaluation
Initially the forecast were made on an evaluation that the initial sales will be 2 million units on a price of $22 each. Advertising costs will be $6 million per annum, with $2 million invested for the launch of the product. The growth rate of sales is assumed to be 10%. The cost of goods sold was $12 each. When analyzing all the data the initial accumulated to be $7.5 million and the discounted cash flow was 33, which results in an NPV of 25 which is positive and so investing the money in this project will be worthwhile if the company manages to make a sale of 2 million units (Exhibit 2).
Second assessment was done on the proposition of increasing the marketing cost and decreasing the cost of the product.This was suggested in order to increase the revenue generation. The cost per unit was to be decreased by $1 and brought to $21 which will increase the sales in total units which will then be 3.25 million units. The marketing budget will be $7.5 million in the first year and $6 million in the following years. As per the calculations, this proposition gave a discounted cash flow of 53 which was higher than the base year estimation. This also resulted in a higher NPV of 46 compared to the base year. This NPV shows that we can earn a lot more by decreasing a dollar and investing more in the advertising of the product (Exhibit 3).
Third proposition suggested the company should increase the price per unit to $23 which will bring down the sales to 1 million units only. We will also decrease the marketing expense to $5 million annually. This was suggested to minimize the cannibalization with in the products. As per this method the cannibalization will decrease to 45% which was near to 75%. The discounted cash flow was 14 and the NPV was 7 which was still positive and this is a very positive sign for a company as the NPV is positive in all the scenarios and company can opt for any of the option (Exhibit 4).
Action plan
Now that the company has the forecasts and the analysis have been made we can decide the action plan.
As per the calculations and the analysis the NPV is positive in all the scenarios, this gives an opportunity for the analysts to choose any of the following propositions. What is not obvious is the element of cannibalization. Cannibalization is when a particular product of a company takes over the sales of company’s another product. This means the sales are overlapped and no new sales are generated. In base year forecast and drive revenue scenarios, sales are totally based on the products performance and the cannibalization effect is eliminated. In order to understand the effect, the calculation in Exhibit 5 shows the dollar sales being overlapped.
In the third proposition the effect on cannibalization is taken to a minimum level and tried to make organic sales. This gives a lower NPV but it still has organic sales and this means the calculation of NPV gives a picture of how a company can benefit even after decreasing the rate of cannibalization.
Company should consider the third proposition as the cannibalization is low, and the sales are acceptable with a positive NPV which shows that the project is a success. The sales will be lower and the product will be high priced this might put company at a risk to make a loss if they won’t be able to achieve the outcome the company should make of 1 million unit sales but launch of this product will not be a threat to other products of the company which itself is a great benefit as the people might go astray if the product fails and the sales fall of this particular product. The failure will affect the sales of other products too.
Evaluation of Consequences
The company needs to cater the market who are looking for an alternative to the expensive dental treatments. Crest is still the market leader and have the largest share in the market. The company has an option of investing the money and pricing the product as per the company’s requirements. In launching another product in the dental category they are challenging their competitors as well as their own product lines. The products will have a cannibalization effect on other products and this will overlap the sales instead of generating additional sales or profits.
The company should make an evaluation in terms of the priorities of the company. Whether they need to establish their new product and take over their own products sale or they want to establish the new product targeting the new market.
Exhibit 1:
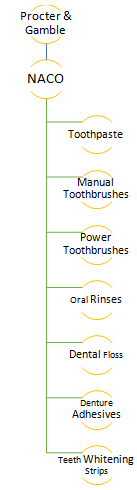
Exhibit 2:
Base Year
| Title | (million $) | ||||
| Years | 0 | 1 | 2 | 3 | 4 |
| Sales ( 2*$22) | 44 | 48 | 53 | 59 | |
| COGS (2*12) | 24 | 26 | 29 | 32 | |
| Gross Profit | 20 | 22 | 24 | 27 | |
| Advertisement Expense | 2 | 6 | 6 | 6 | 6 |
| Selling, general and admin expenses | 1 | 1 | 1 | 1 | |
| Research and development | 1.5 | ||||
| Capital expenditure | 4 | ||||
| Depreciation | 0.8 | 1.3 | 0.8 | 0.5 | |
| EBIT | 12 | 14 | 16 | 19 | |
| Tax (40%) | 5 | 5 | 7 | 8 | |
| EAT | 7 | 8 | 10 | 11 | |
| Free Cash Flows | -7.5 | 8 | 10 | 11 | 12 |
| DCF | 33 | ||||
| NPV | 25 | ||||
| WACC | 8% | ||||
| Assuming that the sale will grow by 10% each year | |||||
Exhibit 3:
Drive Revenue
| Title | (million $) | ||||
| Years | 0 | 1 | 2 | 3 | 4 |
| Sales ( 3.25*$21) | 68 | 75 | 83 | 91 | |
| COGS (3.25*12) | 39 | 43 | 47 | 52 | |
| Gross Profit | 29 | 32 | 35 | 39 | |
| Advertisement Expense | 2 | 7.5 | 6 | 6 | 6 |
| Selling, general and admin expenses | 1 | 1 | 1 | 1 | |
| Research and development | 1.5 | ||||
| Capital expenditure | 4 | ||||
| Depreciation | 0.8 | 1.3 | 0.8 | 0.5 | |
| EBIT | 20 | 24 | 28 | 31 | |
| Tax (40%) | 8 | 10 | 11 | 13 | |
| EAT | 12 | 14 | 17 | 19 | |
| Free Cash Flows | -7.5 | 13 | 16 | 17 | 19 |
| DCF | 53 | ||||
| NPV | 46 | ||||
| WACC | 8% | ||||
| Assuming that the sale will grow by 10% each year | |||||
Exhibit 4:
Minimize Cannibalization
| Title | (million $) | ||||
| Years | 0 | 1 | 2 | 3 | 4 |
| Sales ( 1*$23) | 23 | 25 | 28 | 31 | |
| COGS (1*12) | 12 | 13 | 15 | 16 | |
| Gross Profit | 11 | 12 | 13 | 15 | |
| Advertisement Expense | 2 | 5 | 5 | 5 | 5 |
| Selling, general and admin expenses | 1 | 1 | 1 | 1 | |
| Research and development | 1.5 | ||||
| Capital expenditure | 4 | ||||
| Depreciation | 0.8 | 1.3 | 0.8 | 0.5 | |
| EBIT | 4 | 5 | 7 | 8 | |
| Tax (40%) | 2 | 2 | 3 | 3 | |
| EAT | 3 | 3 | 4 | 5 | |
| Free Cash Flows | -7.5 | 3 | 4 | 5 | 5 |
| DCF | 14 | ||||
| NPV | 7 | ||||
| WACC | 8% | ||||
| Assuming that the sale will grow by 10% each year | |||||
Exhibit 5:
| Cannabalisation | Sales ($ million) | Rate | Cannibalized Sales ($ million) | |||||||||
| Years | 1 | 2 | 3 | 4 | % | 1 | 2 | 3 | 4 | |||
| Base Year | 44 | 48 | 53 | 59 | 75% | 33 | 36 | 40 | 44 | |||
| Drive Revenue | 68 | 75 | 83 | 91 | 75% | 51 | 56 | 62 | 68 | |||
| Minimize Cannibalization | 23 | 25 | 28 | 31 | 45% | 10 | 11 | 13 | 14 | |||
Exhibit 6:

Exhibit 7:
This is just a sample partical work. Please place the order on the website to get your own originally done case solution.
How We Work?
Just email us your case materials and instructions to order@thecasesolutions.com and confirm your order by making the payment here
Related Case Solutions & Analyses:
 EnerNOC: DemandSMART
 Can Innovation Be Lean
 Delta Electronics Hybrid Power Train
 College Summit: Rethinking the Relationship Between Growth and Impact
 Xian International University: The Growth of Private Universities in China
 Beverly Edgehill at The Partnership Inc.
 Destination-U: College Counseling on the Internet
 CDC Capital Partners
 E.I. du Pont de Nemours and Co. (B)
 Good Business Creates Good Business: Southwest Creations Collaborative (B)


