Edward Jones In 2006 Case Study Solution
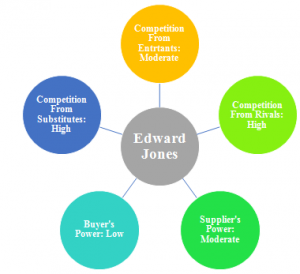
Supplier’s Power
Suppliers in the financial service industry are the stakeholders who bring clients to the company. These suppliers also can be eliminated by the company if it starts offering its products on its own without the help of suppliers. EJ’s suppliers are its financial advisers who directly contact EJ’s client. EJ is primarily dependent on its Financial Advisers for increasingits number of clients, therefore FA charges a huge amount of commission and fee, resulting in the high supplier competition for EJ.
Buyer’s Power
Buyers in the financial service industry can be divided into two categories i.e. individual buyers and institutional buyers. Institutional buyers have a strong bargaining power than the individual customers, due to the low availability of institutional buyers in the market. EJ deals only with the individual buyers, which results in low competition from the buyers for EJ.
Customer Segmentation and Performance
EJ’s core customers are the individual investors and small business owners including Retirees, Pre-retirees and small business owners. The company does not target institutional business customers such as Pension Funds etc. The whole transactions and relationships with the customers are conducted through financial advisers. Each of the customer segment has different characteristics and net worth (Case Exhibit). However, the company provides equal services to all of its customers, regardless of their net worth.The availability of equal services for all of its customers shows the company’s incapability of providing high valued services to the high net worth customers. EJ also does not provide tier services based on the net worth and income level of the customers. Although EJ has some lacking in its performance towards its customers, but it still provides a high level of satisfaction to its customers, as it has been placed at the top in JD powers client satisfaction score.(Smith, 2012)
Quantitative Performance Analysis
Quantitative performance of EJ can be analysed by comparing the financials of EJ with the industry average. A brief comparison of EJ financials with industry is given in the table below:
| Comparison of EJ with Industry | ||
| Edward Jones | Industry Average | |
| Net Revenue | 3,135 | 12525 |
| Pre-tax income | 330 | 3772 |
| Ratios: | ||
| Pre-tax ROS | 10.5% | 32% |
| Pre-tax income/Assets | 7.6% | 2% |
| Assets/Equity | 4.70 | 14.6 |
| Pre-tax ROE | 36.0% | 23.9% |
| Average pre-tax ROE (2000-2005) | 27.8% | 15.8% |
Note: The data is extracted from Case Exhibit 5 and the excel file is attached with the document.
From the abovetable; it can be seen that although the revenue and pre-tax income of EJ are quite below the industry level, but all the financial ratios, except Pre-tax ROS ratio, are above the industry average; showing an overall better financial performance of EJ than its competitors.
Changes in Edward Jones Strategy
EJ has a distinctive strategy, which is being followed by the company for about 30 years. The strategy has made the company a market leader in the US’s financial industry, and has enabled the company to perform better than its competitors. However, the strategy has various negative impacts on the company. By following the traditional strategy, the company has too much conservative attitude towards technology and risks. The company is focused on low risk bearing investments, resulting in lower profits. In the era of increasing trends towards online transactions, the company has not offered any online services as of yet.
As the financial service industry is getting more competitive in various grounds; the company should implement certain changes in its current business strategy, to continue its performance. The following changes are suggested to EJ in its current strategy:
Option 1: Targeting individual, small business as well as institutional business investors.
Option 2: Diversified investments in both high and low risk securities.
Option 3:Reducing the dependence on the financial advisers.
Option 4:Introducing online services with trading offers.
Option 5: Building contacts with Clients.
Option 6: Introducing tier fee structures to provide more value to worthy customers i.e. small business owners.
Recommendations
EJ should continue its current strategy with the above changes. It should implement these changes in its strategy in a systematic manner, in order to avoid any confusion. The company can choose all the change options and can also focus on some of the options. The most important option to be chose non early basis are the option 4, which is of introducing online services, and the option 2 of diversified investments. The implementation of all these changes would allow the company to continue its performance with high growth rates, and would reduce the risk of declination in the company’s performance due to the changing industry scenarios in the future.
Appendices
Appendix A: SWOT Analysis
| Strengths | Weaknesses |
| · Visibility and convenient location
· Focused on high quality product offerings · High customer satisfaction · Unique hiring and training methods.
|
· 76% of accounts below $52000
· Focus on rural and suburban areas only · Only 200 African 200 Hispanics and 100 Asian FA’s · Debate upon FAs · Low risk taking ability · Conservative in use of technology
|
| Opportunities | Threats |
| · Shift to high yield investments
· Shift towards online trading offers · Fast growing market minority African, Asian and Hispanics
|
· Changing industry scenario
· Competition from online brokers
|
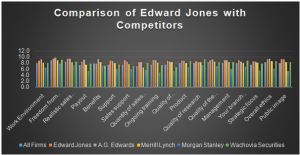
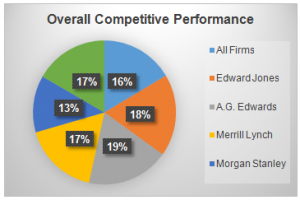
Appendix B: Competitive Performance Analysis
Graph: 1
Graph: 2
Appendix C: Porter’s Five Forces Model
This is just a sample partical work. Please place the order on the website to get your own originally done case solution.


