Carltron LTD Case Case Study Solution
Coverage Ratio
The coverage ratio of the company is greater than 1 but lower than industry average which shows that the company further need to improve its financial health to become more capable of meeting the obligations of interest from the operating earnings.
Gross Profit Margin
The gross profit margin of the company has been declining from 18% in 2001 to 15% in 2003 and it is below than the industry average, it shows that the company is highly affected by the increase the market competition forcing a decline in the selling price and ultimately reduces the market share.
Another reason of decreased gross profit margin is low sales turn out and high cost of direct labor incorporated into the cost of sales. This is because of the fact that the automation system have not made any considerable reduction in the cost of sales and cost of direct labor has remained similar.
Operating Profit Margin
The significant decline in the operating profit margin year to year shows that the company is confronting with the reduced sales. The decline in the margin stipulates that the company is not efficient in making profit on a dollar of sales after paying variable production cost.
Net Profit Margin
The net profit margin of the company has reduced from 5% in 2001 to 0% in 2003 which shows that the company is not efficient in converting its revenues into profit for the year. The company need to adopt cost-cutting measures to improve the revenues such as laying off workers, produce product inexpensively etc.
Another reason behind reduced net profit margin is due to the unchanged high wages, heavy spending on equipment and increased interest expense on debt.
Return on Assets
The return on asset of the company has reduced from 9% in 2001 to 0.1% in 2003 whereas the industry average is 15%. It shows that the company is earning less money on more investment. Also, the company is not efficiently using its asset to generate income.
Return on Equity
The return on equity of the company is declined from 15% in 2001 to 0.4% in 2003 and it is below the industry average i.e. 25%. The significant decline in the percentage of the ROE suggest that the company is not worth investing because of the reason it does not make good use of the money invested by the investors. In other words, it shows that the management of the company is deploying the capital of the shareholders.
The shareholder’s equity is reducing due to the increase expenditure on raw materials, capital equipment, cost of holding finished inventory, increase in selling and administrative cost and labor cost.
Alternatives
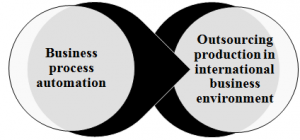
Since, Caltron Ltd. has been failed in achieving the production cost effectiveness and labor efficiency, the following set of alternatives are suggested to address the issues.
Automate administration process
The company could automate the process of administration with the intent of coincide with the developed process of production (Boudreau, 2017).
The pros and cons are discussed below;
Benefits
- Through implementing the automation process, the company would be able to gain competitive advantage both in reliability and operability.
- It would also reduce the cost of operations and increase the reliability and speed of the task development, support and implementation.
Risks
- The fear of losing job amongst employees would be increased, which in turn would likely make them less motivated and encouraged in achieving the organizational objectives.
- The implementation of the process automation would cost huge amount of money to the company, but this factor could be contrasted to the advantages in terms of compliance and productivity.
Outsourcing production in international business environment
The company could approach to the third party manufacturing companies to help in fulfilling the project’s demand, though it would be the massive undertaking(O’Brien, 2014).
The pros and cons are discussed below;
Benefits
- It would allow the company to reach to the large market of more efficient, skilled and cheap labor.
- The labor in international market would not reduce the quality of the product in any matter.
- The company would be able to manufacture the product with greater efficiency and the cost of production would be the greater saving for the company.
- It would result in flexible staffing, reduced turnaround time, improved efficiency and more profit returns.
Risks
- Outsourcing the manufacturing in international market means transferring the jobs in other market. It would put large numbers of domestic workers out of work which can destroy the global brand management of company
- Different employees working condition and moral issues in international market can be extremely difficult.
Recommendation
After taking into consideration the evaluation of the alternatives, the company should automate the administrative process to be able to compete with the market competitors in terms of reliability and operability. This would allow the company to reduce the cost layoff the unnecessary staff. Not only this, It would lead to increased productivity, better product quality, efficient material use, reduced factory lead times and shorter workweeks for the labor.
Outsourcing the whole manufacturing in the international market requires large amount of investment and time, and the company is in dire need of improving its financial and non-financial performance to some extent to avoid divest Caltron.
To exploit the opportunity of having low cost production in automation, the company should seek the help of union leader, because he would help in achieving the common goal of company.
Conclusion
Due to the poor operations of factory, old equipment, and expensive unionized workforce, the financial performance of the company has been reducing with the significant pace. Also, the survival of the company is at the stake, and the core business model is under the threat. The company is adviced to automate the administrative process in order to reduce the cost of operations, improve the bottom line, better product quality, efficient material use, reduce the factory lead times and shorten the workweeks for the labor.
Appendix A – Alternatives
Appendix B – Alternatives
|
Financial Ratio |
2001 |
2002 |
2003 |
Industry Average |
| Current Ratio | 2.992147 | 1.816107 | 1.388861 | 2.700 |
| Cash Ratio | 0.023958 | 0.009486 | 0.012471 | 0.450 |
| Inventory Turnover in Days | 78.12388 | 109.0681 | 107.5396 | 60.000 |
| Accounts Receivable Turnover in Days | 37.21666 | 43.92127 | 46.79796 | 32.000 |
| Accounts Payable Turnover in Days | 21.93966 | 43.31572 | 59.44364 | 15.000 |
| Cash Conversion Cycle | 93.40087 | 109.6737 | 94.89396 | 77.000 |
| Fixed Assets Turnover | 4.274964 | 3.656898 | 4.01673 | 7.000 |
| Total Assets Turnover | 1.770134 | 1.679448 | 1.715225 | 2.500 |
| Debt Ratio | 42% | 67% | 75% | 40% |
| Times Interest Earned | 7.30033 | 1.354434 | 1.032534 | 8.00000 |
| Cost of Borrowing | 7.24% | 9.32% | 11.10% | 6.80% |
| Coverage Ratio | 1.687243 | 1.718894 | 1.710983 | 2.00 min |
| Gross Profit Margin | 18% | 16% | 15% | 22.00% |
| Operating Profit Margin | 9% | 4% | 3% | 13.00% |
| Net Profit Margin | 5% | 1% | 0.1% | 6.00% |
| Return on Assets | 9% | 1% | 0.1% | 15.00% |
| Return on Equity | 15% | 3% | 0.4% | 25.00% |
This is just a sample partical work. Please place the order on the website to get your own originally done case solution.
How We Work?
Just email us your case materials and instructions to order@thecasesolutions.com and confirm your order by making the payment here

