Apollo Group Case Study Solution
1) What are the future prospects of the not-for-profit post-secondary education sector, and for Apollo Group?
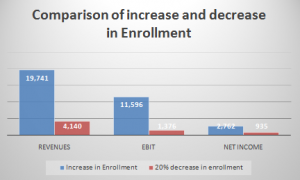
The future prospects of the not for profit post-secondary education sector and for the Apollo Group are low due to the newly passed legislation. The number of students has also decreased based on the pilot testing in 2009 conducted by the University of Phoenix; approximately 20% of all prospective students taking the program opted out and did not enroll at the University of Phoenix. The reason behind the legislation is that the federal data shows that the 25% of the students who attended for the profit colleges defaulted within the three years, which was more than double the rate of those at public institutions and the loans defaults at for-profit colleges accounted for the nearly half of all defaults on federal college loan.
Furthermore, the long investor argued that the student’s loan defaults rates were taken out of context. They claimed that they should be adjusted for the student demographics, including race, gender, financial background and socio economics.
Moreover, in response to the criticism that profit schools used very aggressive students recruiting practices that could be deceptive or even fraudulent.
2) What are the main drivers of free cash flow generation for Apollo? What do you need to assume about the future behavior of those drivers to justify a stock price of $40.55/share?
Their main drivers of the free cash flow are the enrollment fees and tuition fees. As in this case, the enrollment fees will be reduced by new legislation so this will affect the company profitability and ultimately reduced the share price. However, to maintain the stock price of a $40.55/share company should increase the tuition fees to compensate the loss of the enrollment fees. Further, they should increase the quality of the teaching to attract more students. Moreover, to maintain the share Price Company should reduce its operating expenses such as admin expenses to maintain the profitability of the company, these all suggestion will maintain the share price of the company.
3) Estimate the University of Phoenix’s average degree of operating leverage (DOL) for 2008-2010.
The operating leverage is the use of fixed operating costs by the firm. One potential effect caused by the presence of the operating leverage is that a change in the volume of sales results in a more than proportional change in operating profit or loss.
The operating leverage of the company is the 1.30 (2008), 1.37 (2009), 1.67 (2010) calculation is shown in excel sheet.
4) How would you handle the non-cash compensation and operating leases in estimating operating results, and FCF?
The companies were charged comparatively higher tuition taxes and absorbed a disproportionate share of title IV funding while saddling students with a debt burden they might not be able to return. Apollo’s regular practice of paying some employees, in part, with share-based composition instead of cash, as well as the use of operating leases for office and classroom space owing to the real estate outright.
To handle the non cash compensation and operating leases the loan will be given to those students based on their financial condition and family ground. If their family ground is strong then the loan will not be given however if their financial condition is poor the loan will be given by looking his ability to repay the loan. Some students who work in morning and take classes in evening to support the family in financial condition, the loan also are given to those students. Those who have a permanent job rather than contractual will also be given a loan because they will be able to pay the loan on time.
Exhibits
| Unlevered Free Cash Flows | 1 | 2 | 3 | 4 | 5 | 6 | 7 |
| 2011 | 2012 | 2013 | 2014 | 2015 | 2016 | 2017 | |
| EBITDA (1-Tax) | 822 | 1,003 | 1,223 | 1,491 | 1,818 | 2,217 | 2,703 |
| Add: Depreciation | 505 | 616 | 751 | 915 | 1,116 | 1,361 | 1,660 |
| Less: | |||||||
| Capital Expenditure | 150 | 183 | 223 | 272 | 332 | 405 | 494 |
| Change in Working Capital | (8) | 99 | 121 | 147 | 180 | 219 | 267 |
| FCF | 1,185 | 1,336 | 1,629 | 1,987 | 2,423 | 2,954 | 3,602 |
| Terminal Value | |||||||
| Total FCF | 1,185 | 1,336 | 1,629 | 1,987 | 2,423 | 2,954 | 3,602 |
| WACC | 6.29% | ||||||
| Discounted free cash flows | 1,115 | 1,183 | 1,357 | 1,557 | 1,786 | 2,049 | 2,351 |
| Enterprise Value | 11,398 |
| Market Risk Premium | 5% |
| Beta | 0.62 |
| Risk-free rate | 3.47% |
| Cost of Equity | 6.55% |
| Cost of debt | 7.08% |
| Weight of equity | 0.89 |
| Weight of debt | 0.11 |
| Tax | 42% |
| WACC | 6.29% |
comparison
This is just a sample partial case solution. Please place the order on the website to order your own originally done case solution.
How We Work?
Just email us your case materials and instructions to order@thecasesolutions.com and confirm your order by making the payment here
Related Case Solutions & Analyses:
 Winner-Take-All in Networked Markets
 ABRY Partners LLC: WideOpenWest
 China: Building Capitalism with Socialist Characteristics
 Oscar de la Renta
 FedEx and UPS-The War Continues
 Golden Age of Home Video Games: From the Reign of Atari to the Rise of Nintendo
 Adam Opel AG (B) Video
 Note on Process Analysis (Abridged)
 Undermining Staying Power: The Role of Unhelpful Management Theories
 Wildfire Protection: Conflict in the Bitterroot National Forest


