Start Portfolio Strategy ‘SPOCK’ Trainee/rotation Program Case Solution
1.Introduction
The Belt pharma is a pharmaceutical company, which is having a good performance in the industry. The company is making a new asset and is evaluating it on the basis of its phases. The phase 1 is completed and the assessment of phase 2 depends on the ground of phase 1. If it has the successful completion of phase 1, then the research and development department would estimate the next business cycle. The total budget approved by the management is 150mCHF, which includes variables and resources’ cost.
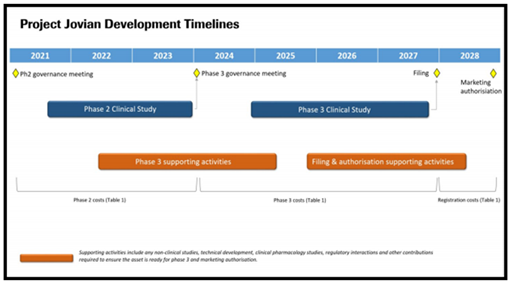
As the project and portfolio manager; we have to analyze the Jovian asset and its progress according to the phases. The duration of the phase 2 is from 2021-2023, phase 3 from 2024-2027 and after phase 2; market authorization would start in 2028 as described in Table 1.
Table 1
Valuation Analysis
Valuation analysis describes the analysis’ cost and profitability. Table 2 describes the assets’ sales and costs. The profit margin is calculated after the cost and launching. The cost margin of assets are: lo 0, Ganymade 214, Jovian 186, Europa 160 and Callisto 190. The overall cost of Jovian is 186 and the budget is 150, which is less than the cost.The profit of all assets are described. The profit margin of lo is 50%,Ganymede 38%, Jovian 46%, Europa 45% and Callisto 80%. Callisto has the higher profit among all.
Table 2
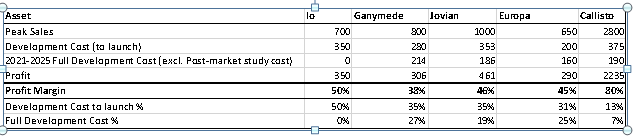
Table 3 defines the variable cost according to the phases and their costs in mCHF. The variable cost and the man years are describing the total variable cost. Phase 1 has 300, phase2 2400, phase 3 has 80000, and the total cost is 132300.
Table 3
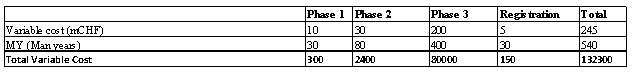
Table 4 describes the probability of technical success PTS. The benchmark of every asset is defined. Jovian has the benchmark of 18% in phase1 and the probability is 66.8% in phase 1 which means higher success. The phase 2 has the benchmark of 18% and the success rate is 0%, which interprets high success in phase 1 and none in phase2 in oncology diseases’ area.Jovian has the benchmark of 68% in phase1 and the probability in phase 1 is 18%, which means it is low. Phase 2 has the benchmark of 39% and the success is 44.5%, which interprets lower success in phase 1 and high er-success in phase2, in ophthalmology diseases’ area.Jovian has the benchmark of 77% in phase1 and its probability is 17.5% in phase 1, which means it has low success. Phase 2 has the benchmark 29% and the success rate of which is 48%, interpreting lower success in phase 1 and higher success in phase2 in neuroscience diseases’ area.Jovian has the benchmark of 80% in phase1, in which its probability is 17.7%, which means low success. Phase 2 has the benchmark of 44% and the success is 49.5%, which interprets lower success in phase 1 and higher success in phase2 in blood disorders’ disease area.
Table 4
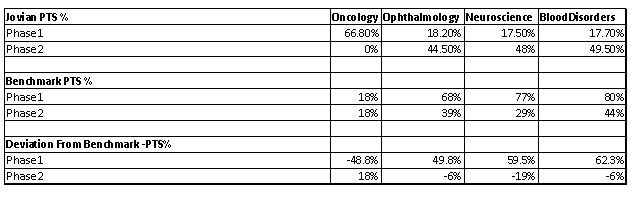
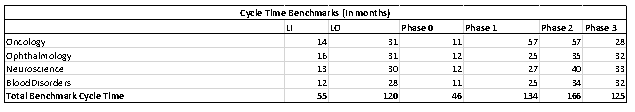
Table 5 shows the total benchmark cycle time for each phase of the assets development. The criteria is according to the benchmark time and it should not exceed from it.
Table 5
.........................
Start Portfolio Strategy ‘SPOCK’ Traineerotation Program Case Solution
This is just a sample partial case solution. Please place the order on the website to order your own originally done case solution.
Related Case Solutions & Analyses:
 Airbus A3XX: Developing the Worlds Largest Commercial Jet (A)
 Meeting the Diversity Challenge at PepsiCo: The Steve Reinemund Era
 Social media: The New Hybrid Element of the Promotion Mix
 Cirque du Soleil–The High-Wire Act of Building Sustainable Partnerships
 HubSpot: Inbound Marketing and Web 2.0
 Symbian Google & Apple in the Mobile Space (A)
 Sanctuary Soft: International Expansion Strategies
 U.S. Subprime Mortgage Crisis: Policy Reactions (B)
 The Walt Disney Company and Pixar Inc.: To Acquire or Not to Acquire
 HP: The Computer is Personal Again


