Statistical Process Control Case Study Solution
The P control chart were used for identifying the upper and lower limits. The P control charts are used for identifying the upper and lower limits of manufactured goods with fraction of defective items. The P control chart indicates that the manufactured process is in control but it does not mean that it is working efficiently because the portion of defective tables is approximately 15%.
Part: 3
Using the data from 25 weeks’ table, the average, UCL, LCL and P control chart was calculated and made. The following table illustrate the 25 weeks data along with calculated average, standard deviation, UCL and LCL.
Table: 2 (Calculated control limits)
| Week | Number of tables | Number of failures | average | UCL | LCL | ST.DEV |
| 1 | 222 | 31 | 0.140 | 0.226 | 0.081 | 0.024 |
| 2 | 176 | 28 | 0.159 | 0.235 | 0.072 | 0.027 |
| 3 | 214 | 30 | 0.140 | 0.227 | 0.079 | 0.025 |
| 4 | 197 | 31 | 0.157 | 0.230 | 0.076 | 0.026 |
| 5 | 180 | 28 | 0.156 | 0.234 | 0.073 | 0.027 |
| 6 | 216 | 26 | 0.120 | 0.227 | 0.080 | 0.025 |
| 7 | 229 | 34 | 0.148 | 0.225 | 0.082 | 0.024 |
| 8 | 199 | 27 | 0.136 | 0.230 | 0.077 | 0.026 |
| 9 – Christmas | 187 | 28 | 0.150 | 0.232 | 0.074 | 0.026 |
| 10 | 64 | 18 | 0.281 | 0.288 | 0.018 | 0.045 |
| 11 | 142 | 23 | 0.162 | 0.244 | 0.063 | 0.030 |
| 12 | 197 | 26 | 0.132 | 0.230 | 0.076 | 0.026 |
| 13 | 209 | 24 | 0.115 | 0.228 | 0.078 | 0.025 |
| 14 | 210 | 38 | 0.181 | 0.228 | 0.079 | 0.025 |
| 15 | 190 | 32 | 0.168 | 0.232 | 0.075 | 0.026 |
| 16 | 207 | 26 | 0.126 | 0.228 | 0.078 | 0.025 |
| 17 | 215 | 28 | 0.130 | 0.227 | 0.080 | 0.025 |
| 18 | 218 | 30 | 0.138 | 0.226 | 0.080 | 0.024 |
| 19 | 183 | 23 | 0.126 | 0.233 | 0.073 | 0.027 |
| 20 | 220 | 45 | 0.205 | 0.226 | 0.080 | 0.024 |
| 21 – Easter | 213 | 29 | 0.136 | 0.227 | 0.079 | 0.025 |
| 22 | 200 | 49 | 0.245 | 0.230 | 0.077 | 0.025 |
| 23 | 194 | 32 | 0.165 | 0.231 | 0.076 | 0.026 |
| 24 | 209 | 33 | 0.158 | 0.228 | 0.078 | 0.025 |
| 25 | 171 | 26 | 0.152 | 0.236 | 0.071 | 0.028 |
| 4862 | 745 | 0.153 |
With the help of above 25 weeks data following P control chart was prepared.
P Control chart
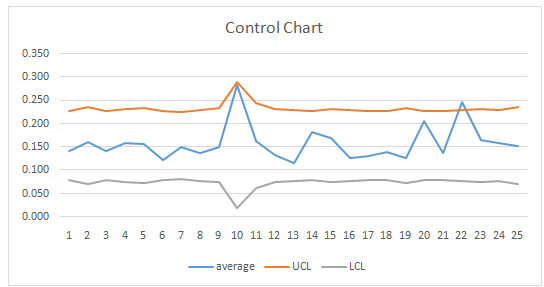
In this P control chart, the average line is touching with the UCL at one point indicating that the statistical process is in control but have in unsafe position. While at another point, the average line exceeding the UCL, indicating that the statistical process is not in the control and the number of defectives items, out of manufactured items, were increased their limit line.
Therefore, it is suggested that the company should make an effective action plan regarding its number of failures in manufactured products. This will not only increase the cost of manufactured product but also, ultimately effect the price mechanism in term of increased price, eventually effect their target market. The number of defective tables were increased tremendously in 21 week, the management must look into this matter and come up with effective solutions such as apply zero defect policy, advanced manufacturing technology, research and development in manufacturing areas and effective strategic policies for cost cutting and minimizing the number of defective items. (Wathen, 1993).
Conclusion
It is concluded after a detailed analysis, the manufacturing companies must look into their statistical process and make some effective strategic moves to minimize the number of defective items produced. In this case, the statistical process was measured by using p control charts. The results suggest that the company is maintaining its statistical process in past 52 weeks but unable to sustain this position in current weeks. The average line touching the UCL and sometime exceeding that line, representing that the number of defective items is increasing. This will ultimately effect their target market. The company must make some strategic moves immediately, to cope up with this intense situation………..
This is just a sample partical work. Please place the order on the website to get your own originally done case solution.
How We Work?
Just email us your case materials and instructions to order@thecasesolutions.com and confirm your order by making the payment here
Related Case Solutions & Analyses:
 J. C. Penney: Reinventing Fair and Square Deals B
 Steven Carpenter at Cake Financial
 The Wright Brothers and Their Flying Machines
 Performance Pay at Safelite Auto Glass (B)
 Netflix Inc. 2011
 Saskferco products Inc.
 Faith And Work: Hobby Lobby And AutoZone


