If the investment is made in three assets rather than two than risk is further diversified due to over all diversification benefit and correlation among the stocks. The following graph depicts the whole scenario,
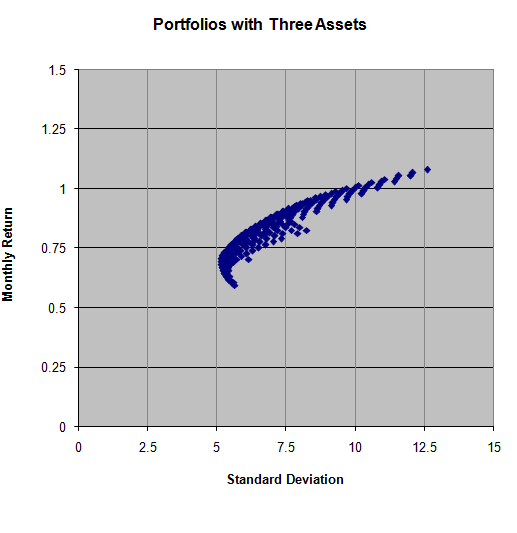
The risk is minimized at the region of between 0.50 to 0.75 returns and between the standard deviation of 5 to 7.5. The overall risk is minimized when there is an addition of more stocks.
If there is an addition of bond in the portfolio then it should be noted that the bond is considered as risk-free, and there is no standard deviation. If any of the investment is made in bond, it will significantly reduce risk and so the standard deviation as well. (Markow it z)
The concept of SML that represent the capital asset pricing model (CAPM) which display the expected rate of return. CAPM asset. CAPM is a model that describes the relationship between risks and expected the return that is used in pricing the risk assets.
If an index is used as an allowable investment than average returns and risk will equal to 1. Which means that the return will be equal to same as index? The net impact will be total portfolio will head towards a positive correlation that will further reduce the benefit of diversification (Berk, 2012)
Recommendation
It is highly recommended to the investor that he should make IPS first then should invest in certain shares. If he is young and has a good salary and can afford risk then he can invest the whole of his investment in stock three, which is riskier and yield higher returns. If investor is retiring and needs a constant amount of income then he should invest in less riskier stock.
Portfolio of investment will also depend upon IPS of the client. Asset allocation in stock will depend upon as per client risk attitude and need in the short term and long term. So it is recommended that if investor’s age is young he should allocate more to stock 3 and less to stock 1 and 2. While if investor is of senior/old age and is risk averse then he should allocate more to stock 1 and less to stock 2 and three.
Exhibits
Two Asset Portfolios
| Portfolio Characteristics | ||
| Plug in variables for two stocks below: | ||
| Stock 1 | Stock 2 | |
| Mean | 0.58 | 0.83 |
| Standard Deviation | 5.80 | 8.24 |
| Correlation of 1 with 2 | 0.30 | |
| Portfolio Expectations Standard Deviation and Returns | ||
| Weight | Standard Dev | Return |
| 0.00 | 8.24 | 0.82534 |
| 0.01 | 8.18 | 0.82291 |
| 0.02 | 8.12 | 0.82049 |
| 0.03 | 8.05 | 0.81806 |
| 0.04 | 7.99 | 0.81564 |
| 0.05 | 7.92 | 0.81322 |
| 0.06 | 7.86 | 0.81079 |
| 0.07 | 7.80 | 0.80837 |
| 0.08 | 7.74 | 0.80594 |
| 0.09 | 7.68 | 0.80352 |
| 0.10 | 7.62 | 0.80109 |
| 0.11 | 7.56 | 0.79867 |
| 0.12 | 7.50 | 0.79624 |
| 0.13 | 7.44 | 0.79382 |
| 0.14 | 7.38 | 0.79139 |
| 0.15 | 7.32 | 0.78897 |
| 0.16 | 7.26 | 0.78654 |
| 0.17 | 7.20 | 0.78412 |
| 0.18 | 7.15 | 0.78169 |
| 0.19 | 7.09 | 0.77927 |
| 0.20 | 7.03 | 0.77684 |
| 0.21 | 6.98 | 0.77442 |
| 0.22 | 6.93 | 0.77199 |
| 0.23 | 6.87 | 0.76957 |
| 0.24 | 6.82 | 0.76714 |
| 0.25 | 6.77 | 0.76472 |
| 0.26 | 6.71 | 0.76229 |
| 0.27 | 6.66 | 0.75987 |
| 0.28 | 6.61 | 0.75744 |
| 0.29 | 6.56 | 0.75502 |
| 0.30 | 6.51 | 0.75259 |
| 0.31 | 6.47 | 0.75017 |
| 0.32 | 6.42 | 0.74774 |
| 0.33 | 6.37 | 0.74532 |
| 0.34 | 6.33 | 0.74289 |
| 0.35 | 6.28 | 0.74047 |
| 0.36 | 6.24 | 0.73804 |
| 0.37 | 6.19 | 0.73562 |
| 0.38 | 6.15 | 0.73319 |
| 0.39 | 6.11 | 0.73077 |
| 0.40 | 6.07 | 0.72834 |
| 0.41 | 6.03 | 0.72592 |
| 0.42 | 5.99 | 0.72350 |
| 0.43 | 5.95 | 0.72107 |
| 0.44 | 5.91 | 0.71865 |
| 0.45 | 5.88 | 0.71622 |
| 0.46 | 5.84 | 0.71380 |
| 0.47 | 5.81 | 0.71137 |
| 0.48 | 5.78 | 0.70895 |
| 0.49 | 5.75 | 0.70652 |
| 0.50 | 5.71 | 0.70410 |
Three Asset Portfolios
| Portfolio Characteristics | |||||
| Plug in variables for three stocks below: | |||||
| Stock 1 | Stock 2 | Stock 3 | |||
| Mean | 0.58 | 0.83 | 1.08 | ||
| Standard Deviation | 5.80 | 8.24 | 12.60 | ||
| Correlation of 1 with 2 | 0.3038 | ||||
| Correlation of 1 with 3 | 0.0801 | ||||
| Correlation of 2 with 3 | 0.2288 | ||||
| Portfolio Expectations: | |||||
| Weights | Standard | ||||
| A | B | C | Deviation | Mean | |
| 0.00 | 0.00 | 1.00 | 12.5992 | 1.0788 | |
| 0.05 | 0.00 | 0.95 | 11.9959 | 1.0540 | |
| 0.10 | 0.00 | 0.90 | 11.4004 | 1.0292 | |
| 0.15 | 0.00 | 0.85 | 10.8138 | 1.0044 | |
| 0.20 | 0.00 | 0.80 | 10.2377 | 0.9796 | |
| 0.25 | 0.00 | 0.75 | 9.6740 | 0.9548 | |
| 0.30 | 0.00 | 0.70 | 9.1251 | 0.9300 | |
| 0.35 | 0.00 | 0.65 | 8.5936 | 0.9052 | |
| 0.40 | 0.00 | 0.60 | 8.0830 | 0.8804 | |
| 0.45 | 0.00 | 0.55 | 7.5977 | 0.8556 | |
| 0.50 | 0.00 | 0.50 | 7.1426 | 0.8308 | |
This is just a sample partical work. Please place the order on the website to get your own originally done case solution.
Related Case Solutions & Analyses:
 Mount Everest–1996
 Ritz-Carlton Hotel Co.
 Integrative Programs in International Business: The Development of Undergraduate Cohort Programs
 Abraaj Capital
 Principals Agents and Partners
 Technical Note on Equity-Linked Consideration Part 3: Cash-and-Stock Deals
 Hotbank: Softbanks New Business Model for Early Stage Venture Incubation
 Team Self Assessment
 Phuket Beach Hotel: Valuing Mutually Exclusive Capital Projects


