Phil’s Haulage Case Study Solution
Expand Business to Other Site Preparation Services
The second alternative for the company is to expand its business in other site preparation services after getting some expertise in these areas of business which can only be get after making some deep cost and benefit analysis of the expansion.
Expand Business to Topsoil Business Segment
The third option for the company is to expand its business in topsoil market, currently it is only 15 percent of company’s overall revenue. This options contains the huge growth opportunities such as the 5 percent yearly growth which will be increase more in future.
Recommendation:
On the basis of the analysis of all three options that are described above, it has been concluded that the company should expand in excavating market, because it is the related diversification in site preparation process business and the great opportunity for the company which need to be avail immediately otherwise the competitors of the business will grab the opportunity which will create the negative impact on company’s cash flows, revenues and profits.
Exhibit 1: SWOT Analysis
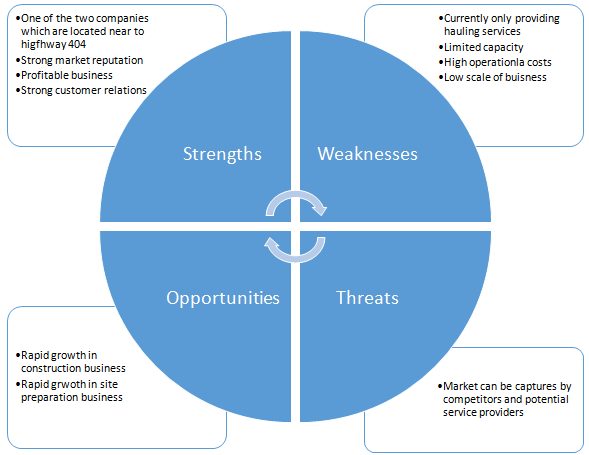
Exhibit 2: Ratio Analysis
| Ratio Analysis (2012) | |||
| Industry Average | PH | Fav / Unfav | |
| Quick Ratio | 1.97 | 1.51 | Unfav |
| Current Ratio | 2.31 | 1.75 | Unfav |
| Days of Accounts Receivable | 65.00 | 69.43 | Unfav |
| Return on Assets | 5.3% | 18% | Fav |
| Net Profit Margin | 10.9% | 8% | Unfav |
| Interest Coverage | 10.3 | 12.75 | Fav |
| Average Total Assets | 3,671,559 | ||
Exhibit 3: DCF Valuation of the Excavation Opportunity (Worst Case)
| DCF Valuation of the Excavation Opportunity (Worst Case) | |||||||||||
| 2012 | 2013 | 2014 | 2015 | 2016 | 2017 | 2018 | 2019 | 2020 | 2021 | 2022 | |
| 0 | 1 | 2 | 3 | 4 | 5 | 6 | 7 | 8 | 9 | 10 | |
| Initial Investment | 2,782,566 | ||||||||||
| Revenues | 2,450,000 | 2,510,025 | 2,571,521 | 2,634,523 | 2,699,069 | 2,765,196 | 2,832,943 | 2,902,350 | 2,973,458 | 3,046,308 | |
| Cost Savings: | |||||||||||
| Transportation Costs Savings | 111,614 | 111,614 | 111,614 | 111,614 | 111,614 | 111,614 | 111,614 | 111,614 | 111,614 | 111,614 | |
| Subcontractor’s Costs Savings | 700,000 | 700,000 | 700,000 | 700,000 | 700,000 | 700,000 | 700,000 | 700,000 | 700,000 | 700,000 | |
| Additional Expenses: | |||||||||||
| Operators’ Salaries | 201,600 | 201,600 | 201,600 | 201,600 | 201,600 | 201,600 | 201,600 | 201,600 | 201,600 | 201,600 | |
| Site Supervisors’ Salaries | 540,000 | 540,000 | 540,000 | 540,000 | 540,000 | 540,000 | 540,000 | 540,000 | 540,000 | 540,000 | |
| Administrative Assistants Salaries | 35,000 | 35,000 | 35,000 | 35,000 | 35,000 | 35,000 | 35,000 | 35,000 | 35,000 | 35,000 | |
| Depreciation Expense | 278,257 | 278,257 | 278,257 | 278,257 | 278,257 | 278,257 | 278,257 | 278,257 | 278,257 | 278,257 | |
| Machinery and Equipment Expenses | 612,500 | 612,500 | 612,500 | 612,500 | 612,500 | 612,500 | 612,500 | 612,500 | 612,500 | 612,500 | |
| Operating Profit | 1,594,258 | 1,654,283 | 1,715,778 | 1,778,781 | 1,843,326 | 1,909,454 | 1,977,201 | 2,046,608 | 2,117,716 | 2,190,565 | |
| NOPAT | 1,355,119 | 1,406,140 | 1,458,412 | 1,511,964 | 1,566,827 | 1,623,036 | 1,680,621 | 1,739,617 | 1,800,058 | 1,861,981 | |
| Add: Depreciation Expense | 278,257 | 278,257 | 278,257 | 278,257 | 278,257 | 278,257 | 278,257 | 278,257 | 278,257 | 278,257 | |
| Net Cash Flows | (2,782,566) | 1,633,376 | 1,684,397 | 1,736,668 | 1,790,220 | 1,845,084 | 1,901,292 | 1,958,877 | 2,017,873 | 2,078,315 | 2,140,237 |
| Discount Rate (Assumed) | 15% | ||||||||||
| Discounted Cash Flows | (2,782,566) | 1,420,327 | 1,273,646 | 1,141,888 | 1,023,564 | 917,333 | 821,981 | 736,415 | 659,646 | 590,787 | 529,034 |
| NPV | $ 6,332,054 | ||||||||||
| IRR | 40% | ||||||||||
Exhibit 4: DCF Valuation of the Excavation Opportunity (Best Case)
| DCF Valuation of the Excavation Opportunity (Best Case) | |||||||||||
| 2012 | 2013 | 2014 | 2015 | 2016 | 2017 | 2018 | 2019 | 2020 | 2021 | 2022 | |
| 0 | 1 | 2 | 3 | 4 | 5 | 6 | 7 | 8 | 9 | 10 | |
| Initial Investment | 2,782,566 | ||||||||||
| Revenues | 5,250,000 | 5,378,625 | 5,510,401 | 5,645,406 | 5,783,719 | 5,925,420 | 6,070,592 | 6,219,322 | 6,371,695 | 6,527,802 | |
| Cost Savings: | |||||||||||
| Transportation Costs Savings | 111,614 | 111,614 | 111,614 | 111,614 | 111,614 | 111,614 | 111,614 | 111,614 | 111,614 | 111,614 | |
| Subcontractor’s Costs Savings | 700,000 | 700,000 | 700,000 | 700,000 | 700,000 | 700,000 | 700,000 | 700,000 | 700,000 | 700,000 | |
| Additional Expenses: | |||||||||||
| Operators’ Salaries | 201,600 | 201,600 | 201,600 | 201,600 | 201,600 | 201,600 | 201,600 | 201,600 | 201,600 | 201,600 | |
| Site Supervisors’ Salaries | 540,000 | 540,000 | 540,000 | 540,000 | 540,000 | 540,000 | 540,000 | 540,000 | 540,000 | 540,000 | |
| Administrative Assistants Salaries | 35,000 | 35,000 | 35,000 | 35,000 | 35,000 | 35,000 | 35,000 | 35,000 | 35,000 | 35,000 | |
| Depreciation Expense | 278,257 | 278,257 | 278,257 | 278,257 | 278,257 | 278,257 | 278,257 | 278,257 | 278,257 | 278,257 | |
| Machinery and Equipment Expenses | 612,500 | 612,500 | 612,500 | 612,500 | 612,500 | 612,500 | 612,500 | 612,500 | 612,500 | 612,500 | |
| Operating Profit | 4,394,258 | 4,522,883 | 4,654,659 | 4,789,664 | 4,927,976 | 5,069,677 | 5,214,850 | 5,363,580 | 5,515,953 | 5,672,060 | |
| NOPAT | 3,735,119 | 3,844,450 | 3,956,460 | 4,071,214 | 4,188,780 | 4,309,226 | 4,432,623 | 4,559,043 | 4,688,560 | 4,821,251 | |
| Add: Depreciation Expense | 278,257 | 278,257 | 278,257 | 278,257 | 278,257 | 278,257 | 278,257 | 278,257 | 278,257 | 278,257 | |
| Net Cash Flows | (2,782,566) | 4,013,376 | 4,122,707 | 4,234,717 | 4,349,471 | 4,467,037 | 4,587,482 | 4,710,879 | 4,837,299 | 4,966,817 | 5,099,507 |
| Discount Rate (Assumed) | 15% | ||||||||||
| Discounted Cash Flows | (2,782,566) | 3,489,892 | 3,117,359 | 2,784,395 | 2,486,824 | 2,220,907 | 1,983,295 | 1,770,994 | 1,581,322 | 1,411,879 | 1,260,520 |
| NPV | $ 19,324,821 | ||||||||||
| IRR | 115% | ||||||||||
Exhibit 5: DCF Valuation of the Excavation Opportunity (Average Case)
| DCF Valuation of the Excavation Opportunity (Average Case) | |||||||||||
| 2012 | 2013 | 2014 | 2015 | 2016 | 2017 | 2018 | 2019 | 2020 | 2021 | 2022 | |
| 0 | 1 | 2 | 3 | 4 | 5 | 6 | 7 | 8 | 9 | 10 | |
| Initial Investment | 2,782,566 | ||||||||||
| Revenues | 3,850,000 | 3,944,325 | 4,040,961 | 4,139,965 | 4,241,394 | 4,345,308 | 4,451,768 | 4,560,836 | 4,672,577 | 4,787,055 | |
| Cost Savings: | |||||||||||
| Transportation Costs Savings | 111,614 | 111,614 | 111,614 | 111,614 | 111,614 | 111,614 | 111,614 | 111,614 | 111,614 | 111,614 | |
| Subcontractor’s Costs Savings | 700,000 | 700,000 | 700,000 | 700,000 | 700,000 | 700,000 | 700,000 | 700,000 | 700,000 | 700,000 | |
| Additional Expenses: | |||||||||||
| Operators’ Salaries | 201,600 | 201,600 | 201,600 | 201,600 | 201,600 | 201,600 | 201,600 | 201,600 | 201,600 | 201,600 | |
| Site Supervisors’ Salaries | 540,000 | 540,000 | 540,000 | 540,000 | 540,000 | 540,000 | 540,000 | 540,000 | 540,000 | 540,000 | |
| Administrative Assistants Salaries | 35,000 | 35,000 | 35,000 | 35,000 | 35,000 | 35,000 | 35,000 | 35,000 | 35,000 | 35,000 | |
| Depreciation Expense | 278,257 | 278,257 | 278,257 | 278,257 | 278,257 | 278,257 | 278,257 | 278,257 | 278,257 | 278,257 | |
| Machinery and Equipment Expenses | 612,500 | 612,500 | 612,500 | 612,500 | 612,500 | 612,500 | 612,500 | 612,500 | 612,500 | 612,500 | |
| Operating Profit | 2,994,258 | 3,088,583 | 3,185,219 | 3,284,222 | 3,385,651 | 3,489,566 | 3,596,026 | 3,705,094 | 3,816,834 | 3,931,313 | |
| NOPAT | 2,545,119 | 2,625,295 | 2,707,436 | 2,791,589 | 2,877,804 | 2,966,131 | 3,056,622 | 3,149,330 | 3,244,309 | 3,341,616 | |
| Add: Depreciation Expense | 278,257 | 278,257 | 278,257 | 278,257 | 278,257 | 278,257 | 278,257 | 278,257 | 278,257 | 278,257 | |
| Net Cash Flows | (2,782,566) | 2,823,376 | 2,903,552 | 2,985,693 | 3,069,846 | 3,156,060 | 3,244,387 | 3,334,878 | 3,427,586 | 3,522,566 | 3,619,872 |
| Discount Rate (Assumed) | 15% | ||||||||||
| Discounted Cash Flows | (2,782,566) | 2,455,109 | 2,195,502 | 1,963,141 | 1,755,194 | 1,569,120 | 1,402,638 | 1,253,704 | 1,120,484 | 1,001,333 | 894,777 |
| NPV | $ 12,828,438 | ||||||||||
| IRR | 78% | ||||||||||
Exhibit 6: Data Sorting
| Case Data | |
| No. of Contracts Worst Case | 7 |
| No. of Contracts Best Case | 15 |
| No. of Contracts Average Case | 11 |
| Average Revenue per contract | 350,000 |
| Total Revenue Worst Case | 2,450,000 |
| Total Revenue Best Case | 5,250,000 |
| Total Revenue Average Case | 3,850,000 |
| Duration (weeks)/contract | 16 |
| Total Duration | 112 |
| New Machinery and Equipment Required | 2,782,566 |
| Machinery and Equipment Expenses | 612,500 |
| No. of Machines(Trucks) | 14 |
| No. of Equipment | 10 |
| Estimated Life of Machinery and Equipment | 10 |
| Depreciation Expense | 278,257 |
| Employees: | |
| No. of Skilled Operators/contract | 4 |
| Total No. of skilled Operators | 28 |
| Rate Per Hour (Total) | 30 |
| Hours worked per day | 10 |
| Total Cost Per Day | 300 |
| Days worked in a week | 6 |
| Total Salaries of skilled operator | 201,600 |
| Salary of Supervisor (annual) | 90,000 |
| No. of site supervisors required | 6 |
| Total Salaries to site supervisor | 540,000 |
| salary of Administrative Assistant (Annual) | 35,000 |
| Other Benefits(Cost Savings): | |
| Transportation Costs Savings | 10% |
| Topsoil Sales | 1,116,144 |
| Transportation Costs Savings | 111,614 |
| Subcontractor’s Costs Savings | 700,000 |
Exhibit 7: Porter’s Five Forces Model
| Barriers to new entrance | High | · High industry growth
· Small requirement of initial capital investment |
| Threat of substitute products | Low | · Specialization in all levels of site preparation services are difficult to be substitute |
| Rivalry among competitors | High | · Higher presence of number of competitors in the industry which increases the level of threat from competitors. |
| Bargaining power of supplier | Low | · The material used in the site preparation services are required only one time purchase during its whole project duration |
| Bargaining power of buyer | High | · The multiple number of service providers in the market have increases the bargaining power of customers |
Exhibit 8: Decision Matrix
| Options or Decision Criteria | Option 1: Expand Business to Excavating Market
|
Option 2: Expand Business to Other Site Preparation Services
|
Option 3: Expand Business to Topsoil Business Segment
|
| Must improve the liquidity position of the company.
|
Yes- With potential amount of cash flows. | May be- With potential amount of cash flows. | May be- With potential amount of cash flows. |
| Must increase the business scale of PH.
|
Yes- with expansion towards excavating services. | Yes- with expansion towards other site preparation services. | Yes- with expansion in topsoil business. |
| Must improve the overall financial performance of the company.
|
Yes- with improvised financial ratios. | May be- with improvised financial ratios. | Yes- with improvised financial ratios and high growth potential. |
| Must reduce the overall operational and sub contractual costs of the company.
|
Yes- with reduction in transportation subcontractor’s and topsoil manufacturing costs. | May be- with synergies in site preparation services. | No- as it would require increased marketing costs. |
This is just a sample partical work. Please place the order on the website to get your own originally done case solution.
How We Work?
Just email us your case materials and instructions to order@thecasesolutions.com and confirm your order by making the payment here
Related Case Solutions & Analyses:
 Veracity Worldwide in Syria: Assessing Political Risk in a Volatile Environment
 UpDown: Confidential Instructions for MICHAEL
 Horizontal Specialization and Modularity in the Semiconductor Industry
 History of Investment Banking
 To Agree or Not to Agree: Legal Issues in Online Contracting
 Sunrise Medical in 1999
 Probability Assessment Appraisal
 Implementing Electronic Road Pricing in Singapore
 Friendly Cards, Inc.
 Lloyds-TSB: A Champion of Shareholder Value 1983 – 2007 (French) French


