Jupyter Project The Case Solution
- Net Cash Flow: The difference between a company's cash inflows and outflows (in dollars)
- Net Income: Revenues minus expenses, interest, and taxes (in dollars)
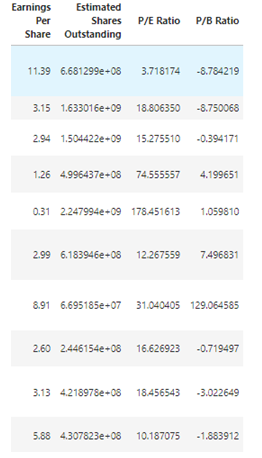
- Earnings Per Share: Company's net profit divided by the number of common shares it has outstanding (in dollars)
- Estimated Shares Outstanding: Company's stock currently held by all its shareholders
- P/E Ratio: Ratio of the company's current stock price to the earnings per share
- P/B Ratio: Ratio of the company's stock price per share by its book value per share (book value of a company is the net difference between that company's total assets and total liabilities)
Data Analysis
In order to determine the data structure, the top ten rows were selected, which are as follows
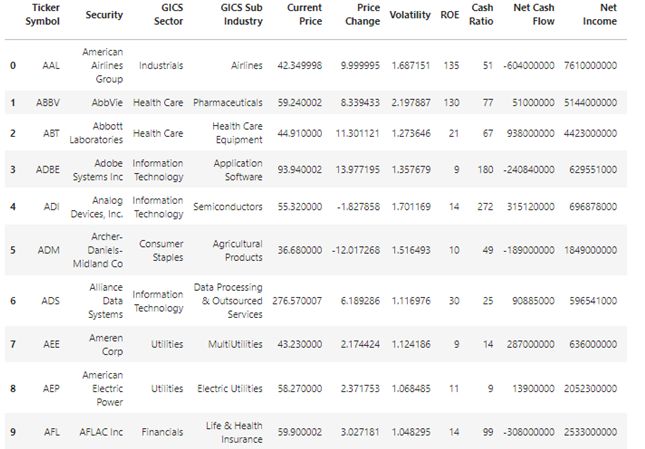
As shown below, the data type has been identified for the complete data set, which shows the “object” type data for the variables including ticker symbol, security, GICS sector, GICS sub-sector.
Descriptive Analysis
The descriptive statistics of the variables are given as below. The descriptive statistics show the mean, standard deviation, minimum and maximum value of different variables. The descriptive statistical analysis show that the mean current price of stocks is 80.86. The average price and price volatility is 4.078 and 4.5259. The return on equity generated by the stock market on average is 39.59%. In addition, the average cash ratio is 70.02. The average values minimum and maximum values of other variable are given as below:
Univariate Analysis
In univariate analysis, univariate descriptive statistics have been calculated for each variable. The mean, minimum, maximum and standard deviation values for each variable are describe above in the descriptive statistics. The frequency of independent variables are shown through histograms, as given below
The histogram ticker symbol shows the overall symbol tickers for each chosen security.
The security histogram shows the company information, within which the security belongs.
The above histogram shows the sector details of each particular security.
The above histogram shows the sub-sector details of each particular security.
The current price histogram shows that most of the companies has stock price between the ranges of 0-100, almost 300 observations lie in this range.
The price change histogram shows that within a period of 13 weeks most of the stocks havegone through a price change of 0-10%. Some stocks have a positiveincrease in stock price even higher than 40% and few had negative change even larger than -40%.
This histogram shows the standard deviation of the stock price over the past 13 weeks.
The ROE histograms show sthate more 300 stcoks have reported a return on equity between 0-100%. Few stocks hav ere ported extremely higher return on equity as mentioned in histogram.
The cahs ratio histogram shows that nearly 250 stocks have a cash ratio of 0-1, 60-70 stocks have a cash ratio of 1-2.
This graph shows the net cash flow generated by the stcoks, and most of the companies have generated a net cash flow -0.5 yo 0.5.
The histograms hsows that nearly 200 companies have reported a net income between 0-0.5 millioin dollars. The others have a higher positive income and few resulted in generating net losses.
The above histogram illustrates theta most of eth companies have reported an earning per share between -0.5 to 0.5.
This histogram the company's stock currently held by all its shareholders and more than 250 companies have outstanding shares between 0-0.5.
The histogram shows that the P?E ratio of approximately 300 companies lie between 0-0.5.
The price to book value histogram reveals that as compare to stocks’ book prices the stocks’ current prices are much lesser.
Outliers
The outliers in the complete data set have been identified and removed, in order to get teh accuracy in the results.
Multivariate Analysis
The multivariate analysis i.e. the relationship between the two or more variables is observed through correlation coefficient analysis (figure given as under). The correlation analysis shows that the current price has a positive correlation with the P/E ratio, P/B ratio, price change, cash ratio, net income and earnings per share and with the rest of variables it has a negative correlation. In addition, the price change has a negative correlation with return on equity and volatility but a positive correlation with other variables. The cash ratio has a positive......................
Jupyter Project The Case Solution
This is just a sample partial case solution. Please place the order on the website to order your own originally done case solution.
Related Case Solutions & Analyses:
 Airbus A3XX: Developing the Worlds Largest Commercial Jet (A)
 Meeting the Diversity Challenge at PepsiCo: The Steve Reinemund Era
 Social media: The New Hybrid Element of the Promotion Mix
 Cirque du Soleil–The High-Wire Act of Building Sustainable Partnerships
 HubSpot: Inbound Marketing and Web 2.0
 Symbian Google & Apple in the Mobile Space (A)
 Sanctuary Soft: International Expansion Strategies
 U.S. Subprime Mortgage Crisis: Policy Reactions (B)
 The Walt Disney Company and Pixar Inc.: To Acquire or Not to Acquire
 HP: The Computer is Personal Again


