Hedge Fund Due Diligence at Leman Alternative Asset Management Company Case Study Analysis
HFRI EH Index
The average monthly return of the HFRI EH Indexis 0.69 percent and the annualized HFRI EH Indexreturn is 0.68 percent with 0.0064 standard deviations, which shows that the values are close to the mean. Also, the Sharpe ratio is 0.55, which is lower than 1 due to which it could be anticipated that the return of the fund would not be better in relation to the risk. The lowest return of the HFRI EH Index is -0.010 and the highest return of the HFRI EH Indexis 0.02. The number of positive returnsis calculated using the IF formula which shows that there are 63 positive returns whose percentage is 30.7. Furthermore, the correlation between the HFRI EH Indexand the S&P 500 is 0.08 which is weak, hence demonstrates a minimal relationship between HFRI EH Indexand the S&P 500.
S&P 500 Index
The average monthly return of the S&P 500 Index is 0.82 percent and the annualized S&P 500 Index return is 0.84 percent with 0.02 standard deviation, which shows that the values are close to the mean. Also, the Sharpe ratio is 0.18 which is lower than 1 due to which it could be anticipated that the return of the fund would not be better in relation to the risk. The lowest return of the S&P 500 Index is -0.07 and the highest return of the S&P 500 Indexis 0.07. The number of positive returnsis calculated using the IF formula which shows that there is 102 positive return whose percentage is 49.76.
One-month Treasury Bills (T-Bills)
The average monthly return of One-month Treasury Bills (T-Bills)is 0.33 percent and the annualized One-month Treasury Bills return is 0.32 percent with 0.0012 standard deviations, shows that the values are close to the mean. Also, the Sharpe ratio is -0.013 which is lower than 1 due to which it could be anticipated that the return of the fund would not be better in relation to the risk. The lowest return of the one-month Treasury Bills is 0.00065 and the highest return of the One-month Treasury Bills is 0.0056. The number of a positive return is calculated using the IF formula which shows that there are 0 positive returnsand all returns are negative. Furthermore, the correlation between One-month Treasury Bills and the S&P 500 is 0.14 which is weak, hence demonstrating a minimal relationship between One-month Treasury Bills and S&P 500.
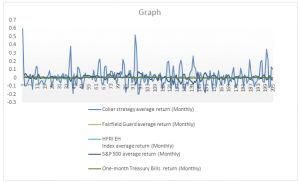
Monthly growth in Value of $1 Invested According to Collar Strategy against Monthly growth in Value of $1 Invested Following Collar Strategy Invested in Fairfield Guard hedge Fund, HFRI EH Index, S&P 500 Index &One-month Treasury Bills (T-Bills)
The graph of the monthly growth in value of $1 invested according to collar strategy against monthly growth in value of $1 invested following collar strategy invested in Fairfield guard hedge fund, HFRI EH index, S&P 500 index & one-month treasury bills (T-bills) is as follows.
Conclusion
With regards to the quantitative analysis and the due diligence of the Fairfield guard hedge fund, it is analyzed that the return on the Fairfield guard hedge fund would be good for the LAAMCO as the Sharpe ratio is greater than 1. Also, the fund has generated positive results than the S&P 500 but, at the same time, it would experience positive returns in just 68 out of 205 which is not acceptable and up-to the mark. So, it is to conclude that the return would be higher than the risk but the number of positive returns would be lower than a number of negative returns....................................
This is just a sample partical work. Please place the order on the website to get your own originally done case solution.
Related Case Solutions & Analyses:
 Corporate Reputations: Built In or Bolted On
 Dow Chemical: Innovating for Sustainability
 Keeping a Campaign Promise: George W. Bush and Medicare Prescription Drug Coverage
 Learning Teams: Shrinking to Fit (A)
 Intel Corp. in 1999
 Note on International Comparisons Concerning Troubled Companies
 Campbell and Bailyn’s Boston Office: Managing the Reorganization, Spanish Version
 STATS & OPERATIONS TASK


