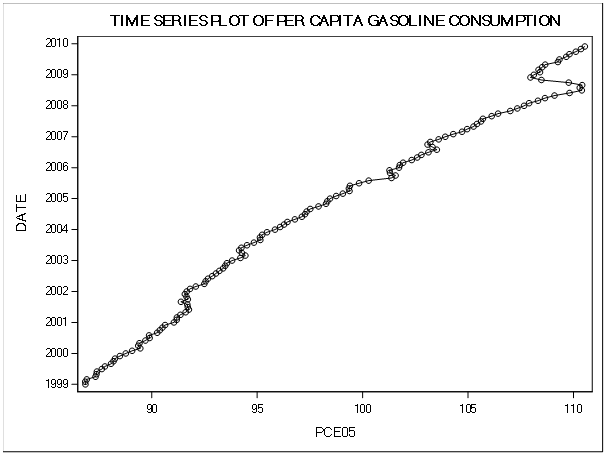
The per capita Gasoline consumption has risen steadily from the period from 1999 to 2010. The only variability was seen in 2008’s economic turmoil. The gas consumption curve has been at a 45 degree showing that the consumption has been increasing at a constant rate. Also, the political turmoil of 2001-2005 didn’t deteriorate per capital Gasoline consumption, showing that the US citizen sensitivity didn’t have any effects on situations like 9/11 or war with the Middle East.
| Root MSE | 2.72675 | R-Square | 0.0059 |
| Dependent Mean | 4.87500 | Adj R-Sq | -0.1598 |
| CoeffVar | 55.93333 |
| Parameter Estimates | ||||||
| Variable | Label | DF | Parameter Estimate |
Standard Error |
t Value | Pr > |t| |
| Intercept | Intercept | 1 | 5.15604 | 1.77590 | 2.90 | 0.0272 |
| July | July | 1 | -0.06813 | 0.36156 | -0.19 | 0.8567 |
The regression analysis between Gasoline consumption and month of July doesn’t possess a relationship as its R-sq. is extremely weak at 0.0059 showing no relationship. A change in the month would not have a significant effect on the gasoline consumption.
| Parameter Estimates | ||||||
| Variable | Label | DF | Parameter Estimate |
Standard Error |
t Value | Pr > |t| |
| Intercept | Intercept | 1 | 5.15604 | 1.77590 | 2.90 | 0.0272 |
| July | July | 1 | -0.06813 | 0.36156 | -0.19 | 0.8567 |
The regression equation shows that if the factor of July month is removed, people would still consume $5.15 of the gasoline.
Dummy Variables
| Root MSE | 3.06976 | R-Square | 0.0059 |
| Dependent Mean | 4.12500 | Adj R-Sq | -0.1598 |
| CoeffVar | 74.41831 |
| Parameter Estimates | ||||||
| Variable | Label | DF | Parameter Estimate |
Standard Error |
t Value | Pr > |t| |
| Intercept | Intercept | 1 | 4.54596 | 2.48365 | 1.83 | 0.1169 |
| February | February | 1 | -0.08635 | 0.45825 | -0.19 | 0.8567 |
The R-squ of 0.0059 shows that there is no relationship between gasoline consumption and February. This means that any change from month of February to another month won’t have any effect on the gasoline consumption.
(Feb)
The regression equation shows that if the month or dummy variable is removed from the equation the total gasoline consumption will be $4.54.However, for the month of February, the consumption reduces to $0.086.
Conclusion
The changes in the prices of Gasoline and similar changes to the income of the people creating an impact on the demand for Gasoline in the US; is the primary issue that the policymakers are concerned about. The demand for Gasoline further helps in developing policies regarding an enhanced tax system. It will be up to the measure of demand that proper environmental strategies will be implemented across the US. Therefore, the study has been conducted to determine the sensitivity of the US consumption of Gasoline depending upon the structural behavioural factors..........
This is just a sample partical work. Please place the order on the website to get your own originally done case solution.
Related Case Solutions & Analyses:
 NTT DoCoMo (TM): Value Innovation at DoCoMo
 Googles Android: Will It Shake Up the Wireless Industry in 2009 and Beyond
 Butler Shine Stern & Partners
 American National Red Cross (B)
 Lincoln Industries
 Motive Communications
 Womens Professional Basketball and the American Basketball League
 Banking on Change (A)


