Dawson Forest Products Inc. Case Study Solution
Recommendations
With the deep analysis of Company’s operational environment and qualitative and quantitative evaluation of each alternative, the company is recommended to continue the Biomass Conversion Project. Although, the Biomass has a low NPV than the Alternative 1, but it has high long term qualitative benefits as compare to alternative 1. The positive NPV proves the feasibility of the project and its benefits in terms of accomplishment of targets, utilization of wood residues, carbon offsets, and avoidance of high tax rates shows the long term feasibility of the project. Under alternative 1, the company would not be able to accomplish the targets given by the provincial authority and could face severe political problems. Therefore, in order to gain quantitative plus qualitativegains in long run, the company should continue the Biomass conversion projects.
Implementation
While implementing the project, the company should consider previous loopholes in the project to avoid the issues. It should revise its budgets and perform sensitivity analysis as well to determine the actual worth of the project and reduce the risks of huge differences in allocated and actual figures. Afterwards, it should supervise the overall progress of the project to avoid the huge gaps in budgeted and actual time periods. After managing these two loopholes, the company should focus on reducing operational, maintenance and administration costs related to thermal system. It should try to fully utilize its biomass system to earn more and more carbon offsets.
Monitor and Control
The company should monitor its overall performance on monthly and weekly basis to avoid minor lacking on early basis. It should prepare monthly budgets as well to monitor and control the performance efficiently.It should set various Key Performance Measures(KPI’s) to measure the performance.These KPI’s can include difference in budgeted and actual monthly costs and time efficiency. With potential supervisions and effective planning, the company can implement and monitor its Biomass Conversion Project efficiently.
Conclusion
Although the company has huge differences in its budgeted and actual costs, but these differences are due to the incapability of the company to efficiently allocate the costs. These differences do not determine the feasibility of the Conversion Project. With the increasing environmental regulations and carbon tax rates, the conversion project can be beneficial for the company in the long run.
Exhibits
Exhibit A: PESTEL Analysis
| Political and Legal | Economic | Social and Demographic | Technological | Environmental
|
| · Carbon Tax Rates.
· GHG emission Regulations.
|
· Trends in Housing Market.
· Purchasing Power of individuals |
· Population
· Willingness to by wood products. · House Decorating Culture. |
· Thermal Systems.
· Introduction of Biomass Technologies. |
· Seasonal Temperature of the region.
· Humidity |
Exhibit B: Root Causes
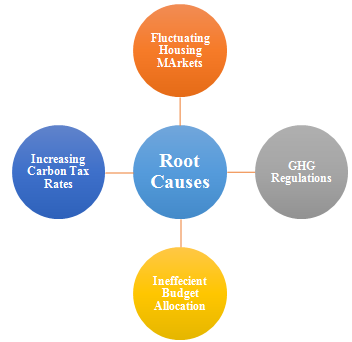
Exhibit C: Quantitative Evaluation of Alternatives
| Continue Biomass Conversion Project | |||||||||||
| 2017 | 2018 | 2019 | 2020 | 2021 | 2022 | 2023 | 2024 | 2025 | 2026 | 2027 | |
| Outflows: | |||||||||||
| Remaining Outlay distributed over 2 years | 3.952 | 3.952 | |||||||||
| Operation and Maintenance | 0.006 | 0.006 | 0.007 | 0.007 | 0.008 | 0.008 | 0.009 | 0.009 | 0.010 | 0.010 | 0.011 |
| Supervisions | 0.005 | 0.005 | 0.006 | 0.006 | 0.006 | 0.007 | 0.007 | 0.008 | 0.008 | 0.009 | 0.009 |
| Inflows: | |||||||||||
| Credit Offsets | 0.180 | 0.183 | 0.186 | 0.189 | 0.192 | 0.195 | 0.198 | 0.202 | 0.205 | 0.208 | 0.211 |
| Wood Pellet Selling 50% | 0.663 | 0.674 | 0.685 | 0.696 | 0.707 | 0.718 | 0.730 | 0.741 | 0.753 | 0.765 | 0.778 |
| Net Cash Flows | -3.120 | -3.107 | 0.858 | 0.871 | 0.885 | 0.899 | 0.912 | 0.926 | 0.940 | 0.955 | 0.969 |
| NPV in millions | $ 1.26 | ||||||||||
| Alternative 2: Continue Current Practices | |||||||||||
| 2017 | 2018 | 2019 | 2020 | 2021 | 2022 | 2023 | 2024 | 2025 | 2026 | 2027 | |
| Outflows: | |||||||||||
| Natural Gas Consumption | 0.405 | 0.195 | 0.094 | 0.045 | 0.022 | 0.010 | 0.005 | 0.002 | 0.001 | 0.001 | 0.000 |
| Tax | 0.316 | 0.422 | 0.527 | 0.633 | 0.738 | 0.844 | 0.949 | 1.055 | 1.160 | 1.265 | 1.371 |
| Operation and Maintenance | 0.005 | 0.006 | 0.006 | 0.006 | 0.007 | 0.007 | 0.008 | 0.008 | 0.009 | 0.009 | 0.010 |
| Supervisions | 0.005 | 0.005 | 0.005 | 0.005 | 0.006 | 0.006 | 0.006 | 0.007 | 0.007 | 0.008 | 0.008 |
| Sunk Cost | 2.553 | ||||||||||
| Inflows: | |||||||||||
| Wood Pellet Selling 100% | 1.326 | 1.407 | 1.493 | 1.584 | 1.680 | 1.783 | 1.892 | 2.007 | 2.129 | 2.259 | 2.397 |
| Net Cash Flows | -1.958 | 0.780 | 0.861 | 0.894 | 0.908 | 0.916 | 0.923 | 0.935 | 0.952 | 0.977 | 1.008 |
| NPV in millions | $6.31 | ||||||||||
Exhibit D: Comparison of Kiln Drying and Thermal Oil Drying System
| Kiln Drying
|
Thermal oil drying System | |
| Drying Time | 1-6 days | Less time |
| Energy use | Intensive | Less |
| Technology | Dated | Dated |
| Source of Energy | Natural Gas | Waste Woods |
| Product Quality | Normal | Better |
| Transportation Cost and emissions | As usual | Reduced |
| Supervision Costs | As usual | Increased |
| Operation and Maintenance Costs | As usual | Increased |
| Storage | Natural Gas is Non store able | Forestry biomass is store able |
| Supply of Heat and Energy | Constant supply of heat and energy | |
| Dependency | Dependent on availability of Natural Gas | Dependent on local logging activity |
| Uniformity | Uniform energy | Particle content and combustion characteristics varied |
This is just a sample partical work. Please place the order on the website to get your own originally done case solution.
Related Case Solutions & Analyses:
 Pacific Community Ventures & Galaxy Desserts: Community Development through Private Equity Investing
 Prime Micro Inc.
 The Auction for Travelport (B)
 CCBN.COM
 Franco Bernabe at ENI (B)
 Facebook
 Nokia India Battery Recall Logistics


