Web Analytics at Quality Alloys Case Study Solution
Analysis of distribution of the pounds sold data with that of the daily visit data.
The distribution of pounds sold data and daily visit data are compared. The distribution of pounds sold data follows empirical rule better because 99% of its actual values fall within 3 standard deviation of the mean. However only 98% of daily visit data falls within 3 standard deviation of mean. Histogram results indicate that visits are not Normal. Z scores indicate that more data clustered around center than Norman and more data at far right than at far left. The data is skewed positive with positive kurtosis.
Main Conclusions
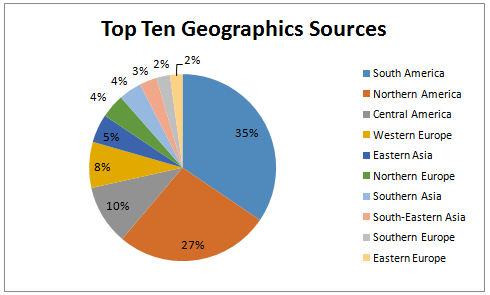
Figure 10 A of traffic sources indicates that referring sites have more weight age as compared to others. If search engine source is analyzed then Google is on the top. Windows is top operating system among all. If all top ten referring sites are taken into account then the visits would sum to 38,754. South America is top on geographical sources which are followed by North America (Figure 10e).
Recommendations
QA Inc. wants to come out from the traditional style of marketing and has developed their own website to gather larger orders from old and newer customers. The data reveals that the company has seen a high variability in number of website visits from May, 2008 to August 2009. The overall average of 150 daily visits doesn’t gives the clear picture as the data is non-symmetrical and website saw daily visits of 75-100 visits per day in majority of days throughout the year.
It is recommended that the company must have data of more than a year to have a much clear picture. Apart from this, the company must have the data of daily visits against the date. Like this, it would be possible for the firm that which particular day saw low daily visits and on which date there were higher number of visitors. By doing this, they would know what they should do to boost the number of visits. Furthermore, the company should use different strategies to attract greater number of visitors per day. They could also enhance the company’s digital marketing department so that more customers could flock to the website.
Appendix
Figure 1a
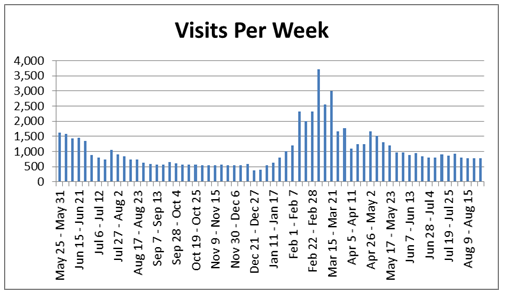
Figure 1b
Figure 1c
Figure 1d
Figure 1e
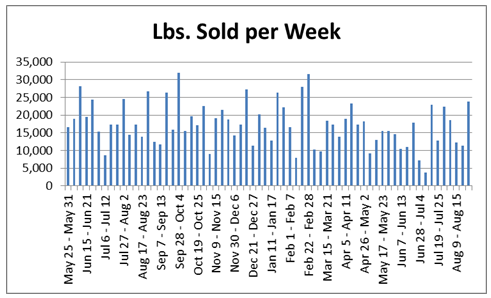
Figure 2a
| Initial Period | |||||
| Visits | Unique Visits | Revenue | Profit | Lbs. Sold | |
| mean | 1,055 | 976 | $608,250 | $200,233 | 18,737 |
| median | 899 | 846 | $586,170 | $208,913 | 17,270 |
| std. dev. | 355.03 | 319.60 | $155,930 | $60,692 | 5,427.39 |
| min | 626 | 594 | $274,568 | $62,580 | 8,633 |
| max | 1,632 | 1,509 | $890,077 | $275,218 | 28,053 |
| Pre-Promotion | |||||
| Visits | Unique Visits | Revenue | Profit | Lbs. Sold | |
| mean | 563 | 517 | $534,314 | $159,932 | 18,441 |
| median | 558 | 510 | $534,542 | $152,476 | 17,215 |
| std. dev. | 80.87 | 70.94 | $150,503 | $42,683 | 5,965.63 |
| min | 383 | 366 | $315,647 | $100,388 | 8,992 |
| max | 795 | 734 | $951,216 | $273,175 | 31,969 |
| Promotion | |||||
| Visits | Unique Visits | Revenue | Profit | Lbs. Sold | |
| mean | 1,814 | 1,739 | $456,399 | $131,930 | 17,113 |
| median | 1,663 | 1,585 | $413,937 | $114,328 | 17,299 |
| std. dev. | 758.10 | 743.03 | $161,741 | $47,777 | 6,519.07 |
| min | 1,000 | 930 | $268,160 | $81,841 | 7,814 |
| max | 3,726 | 3,617 | $897,164 | $266,477 | 31,496 |
| Post-Promotion | |||||
| Visits | Unique Visits | Revenue | Profit | Lbs. Sold | |
| mean | 857 | 801 | $371,728 | $111,046 | 14,578 |
| median | 848 | 800 | $348,397 | $104,530 | 13,647 |
| std. dev. | 70.89 | 72.36 | $145,728 | $49,065 | 5,941.56 |
| min | 772 | 709 | $133,967 | $32,825 | 3,826 |
| max | 963 | 912 | $615,950 | $206,441 | 23,762 |
Figure 3a
| Means | |||||
| Period | Visits | Unique Visits | Revenue | Profit | Lbs. Sold |
| Initial | 1,055 | 976 | 608,250 | 200,233 | 18,737 |
| Pre-Promotion | 563 | 517 | 534,314 | 159,932 | 18,441 |
| Promotion | 1,814 | 1,739 | 456,399 | 131,930 | 17,113 |
| Post-Promotion | 857 | 801 | 371,728 | 111,046 | 14,578 |
Figure 5a
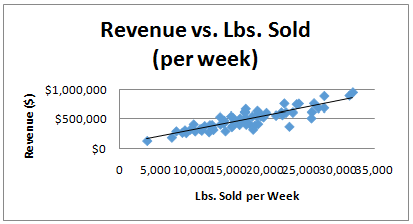
| correlation (rev, lbs. sold) | 0.8689 |
Figure 6a
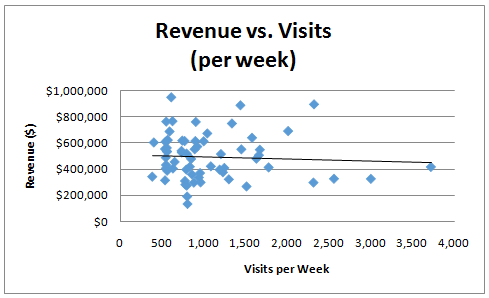
| correlation (revenue, visits) | -0.0594 | |
| (effectively zero) | ||
Figure 8a
| Lbs. Sold | |
| Mean | 18,681.56 |
| Standard Error | 401.69 |
| Median | 17,673.00 |
| Mode | 28,865.00 |
| Standard Deviation | 6,840.51 |
| Sample Variance | 46,792,548.87 |
| Kurtosis | 0.5637 |
| Skewness | 0.6323 |
| Range | 40,914 |
| Minimum | 3,826 |
| Maximum | 44,740 |
| Sum | 5,417,651 |
| Count | 290 |
Figure 8b
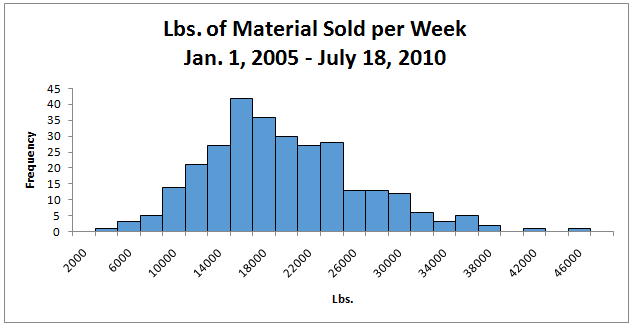
Figure 10a
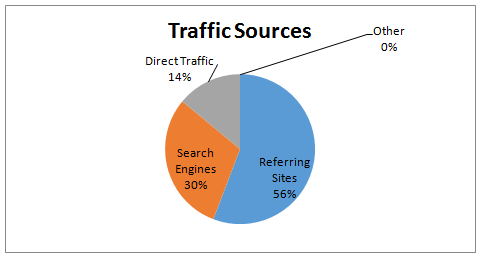
Figure 10b
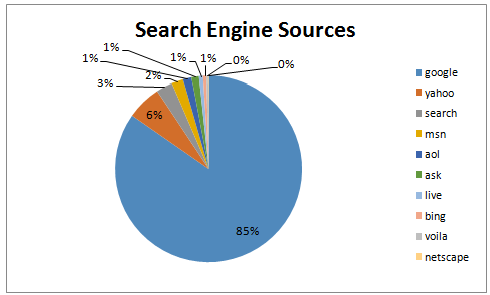
Figure 10c
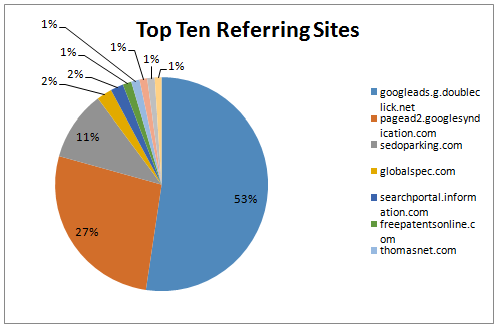
Figure 10d
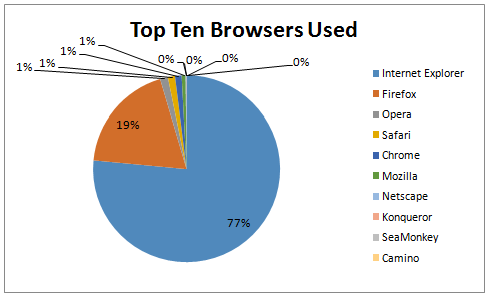
Figure 10e
Related Case Solutions & Analyses:
 Pacific Community Ventures & Galaxy Desserts: Community Development through Private Equity Investing
 Prime Micro Inc.
 The Auction for Travelport (B)
 Cocoa Petes Chocolate Adventures (Abridged)
 BRICS
BRICS
 How to Convince Skeptical Investors


