Megamart Seasonal Demand Planning Case Study Help
Analysis
Question-1: Push Strategy Approaches
Due to increasing service-level declines, delays in deliveries and overall dissatisfaction of clients and finance manager at the firm, management at Megamart pursued various approaches to cater all these problems. One of the approaches in its early efforts to cater the problem include implementation of Push Strategy. Under this strategy the firm adopted two different approaches to push inventories directly to the stores in order to avoid gridlock during spring season. The two approaches are explained below.
Direct-Shipment Approach
Under this approach the firm eliminated the distribution centers form the distribution channel in an attempt to avoid huge inventor holdings at distribution centers. Here the firm assumed that each store has the same demand ratio for each of the SKU. Hence identical full containers of single SKUs were sent to each store. However, in reality, each store has different demand ratio for each SKU. This approach resulted in low service levels, excessive inventory levels, and huge transshipment costs to ship inventory where it is required. The total losses accumulated under this approach was higher than $2 million.
Cross-Dock Approach
Under this approach the firm eliminated the burden over distribution centers by inbound transfers of inventories regardless of the season or month in an attempt to avoid huge inventor holdings at distribution centers. Here the firm assumed that each store has identical demand throughout the year. However, in reality, each store has different demand ratio for each SKU with highly seasonal nature of demand. This approach resulted in low service levels, excessive inventory levels, and huge transshipment costs to ship inventory where it is required. Although distribution costs were reduced by 10%. The total losses accumulated under this approach was about $750K.
Question-2: Reason for Miserable Failure of just-in-time approach
The third attempt to cater the issues with grill supply was just-in-time approach. Although, this approach works efficiently for some organizations and various product categories. However, here the approach failed miserably due to the physical characteristics of grill including; high volume, high time to unload, cautious and time consuming unloading, special shipment procedures etc. The bulky nature of the grill made distribution centers unable to handle a sudden flow of grills during peak seasons resulting in delays in shipments, missed sales, high labor costs due to overtime and third party involvement. The approach resulted in above $20 million loss of sales.
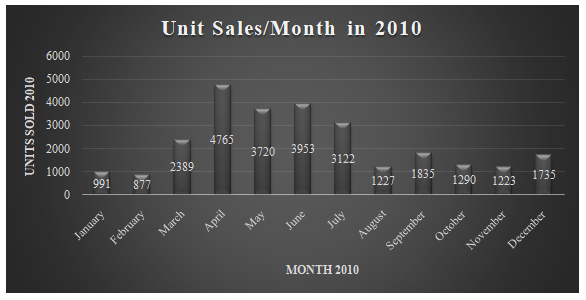
Question-3: Megamart Pattern of Demand in 2010
The pattern of Demand for each SKU is summarized in monthly form and given in Table 1 and the Chart 1a and 1b below.
Table-1
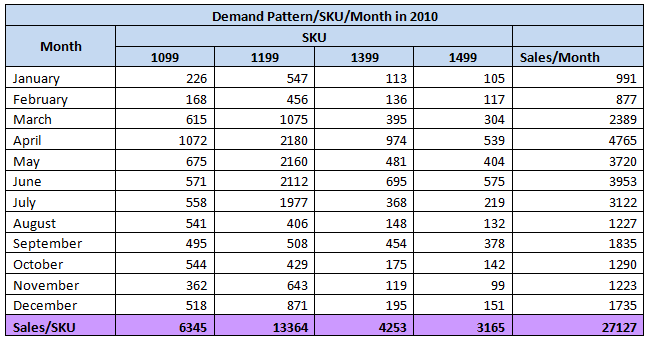
Chart-1 (A)
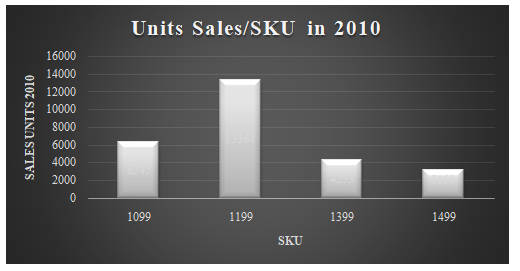
Chart-1 (B)
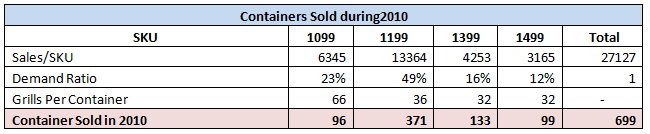
Question-4: Containers of Grills Sold During 2010
Number of containers sold for each SKU in 2010 are given in Table 2 below.
Table-2
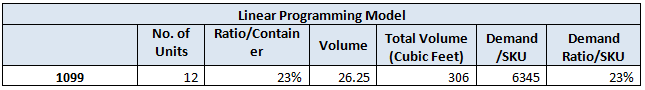
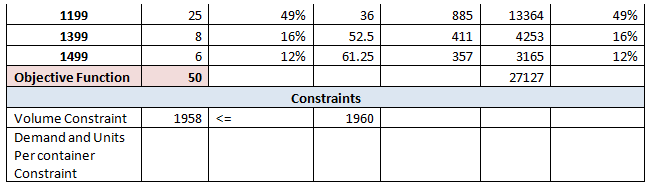
Question-5: Optimal Mixed-Container Configuration
A single configuration for a mixed container can be derived which fits with the demand of almost each store under study. This is conducted using linear programming model through excel solver in excel which has an objective function of maximizing number of total grills and depends upon the demand ratio based on demand data for 2010 and the total volume of the container that is considered to be the maximum volume of grills a container has adjusted that 1960 cubic feet for SKU 1499. See Table 3 for Linear Programming Model.
Table-3
The direct-to-store mixed container strategy will be implemented in the months when the demand for each SKU is high for each store including March, April, May and June. However, this is just a statement based on highest demand per month. The best way to increase service levels and reduce gridlock is to ship mix containers throughout the year on the basis of demand.
Question-6: Feasibility of Mixed-Container Strategy
The store level data is first summarized using Pivot Table Function and then a demand ratio is calculated for each store for each SKU by dividing sales units of particular SKU for a store by total sales of the store.
Formula:Sales Units SKUxStorey /Total Sales Units Storey
After calculating demand ratio for each store for each SKU, an average demand ratio is calculated for each SKU and is compared with the ratio of each SKU in mixed container. See Table 4 below.
Table-4
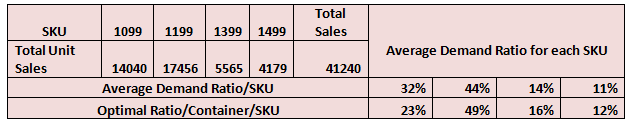
It could be seen from the above table that the two quantities are almost similar. Hence it could be said that the proposed configuration will fit with most of the stores under study................
Megamart Seasonal Demand Planning Case Study Help
This is just a sample partial case solution. Please place the order on the website to order your own originally done case solution.
Related Case Solutions & Analyses:
 Airbus A3XX: Developing the Worlds Largest Commercial Jet (A)
 Meeting the Diversity Challenge at PepsiCo: The Steve Reinemund Era
 Social media: The New Hybrid Element of the Promotion Mix
 Cirque du Soleil–The High-Wire Act of Building Sustainable Partnerships
 HubSpot: Inbound Marketing and Web 2.0
 Symbian Google & Apple in the Mobile Space (A)
 Sanctuary Soft: International Expansion Strategies
 U.S. Subprime Mortgage Crisis: Policy Reactions (B)
 The Walt Disney Company and Pixar Inc.: To Acquire or Not to Acquire
 HP: The Computer is Personal Again


