Harbor City Health Spa Case Study Solution
Projected Revenues and Costs
Previously, the firm’s accountant used to project costs on the basis of inflation rate ranging from 5% to 10%, however, as the costs are supposed to be activity based, so the growth in costs must also be based on the activity level or the expected growth in the number of visitors that is 10%. On the basis of these growth percentages, three different projected income statements have been formulated on the basis of their different prices i.e. previous average price per visit, suggested average price per visit and suggested price per activity department. The three projected income statements for Harbor City are given in Appendix 5.
It could be seen that from if the company would charge the previous average price i.e. $10.7, it would have a deficit of 3%. However, if the company would charge the suggested prices including the average price of $16 and the prices per activity department which are based upon costs, it will have a surplus of 32% and 0.47% respectively.
Recommendations
From the above analysis, the company is recommended to pursue the suggested prices per activity department on the basis of its required profit margin as given in the Appendix 4 based on a 5% profit margin. Although, the profit margin with the average price per activity i.e. $16 is much higher than the price per activity department i.e. 32% as compared to 0.47%, but the suggested to pursue individual prices to provide reasonable prices to its customers ibn order to avoid competitive threats in the industry. By implementing an individual pricing strategy, the company could mitigate its losses and became self-sufficient. However, the company must put cost cutting measures along with the individual pricing strategy to provide competitive pricing in the market.
Appendices
Appendix-1: Average Charge per Visit
| Average Charge Per Visit As Whole | |
| Average Cost Per visit | |
| Total Costs | 362000 |
| Total Number of Visitors | 32900 |
| Average Cost Per Visit | 11 |
| Average Price Per Visit | |
| Total Revenues | 350450 |
| Total Number of Visitors | 32900 |
| Average Price per Visit | 10.7 |
Appendix-2: Costs Allocations
Table-2.1: Allocated Costs for each Department
| Cost Allocation | |||||||||
| Department | Expenses | ||||||||
| Salaries | Other | Administration | Rent | Utilities | Cleaning | T&E | Record Keeping | Total | |
| Yoga | 28333 | 8000 | 6403 | 3600 | 1000 | 600 | 6250 | 1520 | 55706 |
| Aerobic Training | 13333 | 15000 | 3013 | 4680 | 1300 | 780 | 1250 | 3040 | 42396 |
| Nutrition Counselling | 13333 | 16000 | 3013 | 1080 | 300 | 180 | 15000 | 638 | 49545 |
| Seaweed/Mud Soaks | 30333 | 6000 | 6855 | 1800 | 500 | 300 | 625 | 1216 | 47629 |
| Weight Clinic | 28333 | 8000 | 6403 | 3600 | 1000 | 600 | – | 426 | 48362 |
| Swimming | 8333 | 8000 | 1883 | 6480 | 1800 | 1080 | – | 456 | 28032 |
| Nautilus Workouts | 8667 | 10000 | 1959 | 3960 | 1100 | 660 | 625 | 760 | 27730 |
| Massage Therapy | 23333 | 10000 | 5273 | 3600 | 1000 | 600 | 1250 | 1945 | 47002 |
| Administration | – | – | – | 1800 | 500 | 300 | – | – | 2600 |
| Record Keeping | – | – | 1582 | 1080 | 300 | 180 | – | – | 3142 |
| T&E | – | – | 3616 | 4320 | 1200 | 720 | – | – | 9856 |
| Total | 154000 | 81000 | 40000 | 36000 | 10000 | 6000 | 25000 | 10000 | 362000 |
Table-2.2: Allocated Cost per Visit for Each Activity Department
| Average Cost Per Visitor (Activity Department) | |
| Activity | Cost Per Visitor |
| Yoga | 11 |
| Aerobic Training | 4 |
| Nutrition Counselling | 24 |
| Seaweed/Mud Soaks | 12 |
| Weight Clinic | 35 |
| Swimming | 19 |
| Nautilus Workouts | 11 |
| Massage Therapy | 7 |
| Total Cost Per Visitor (Activity Department) | 123 |
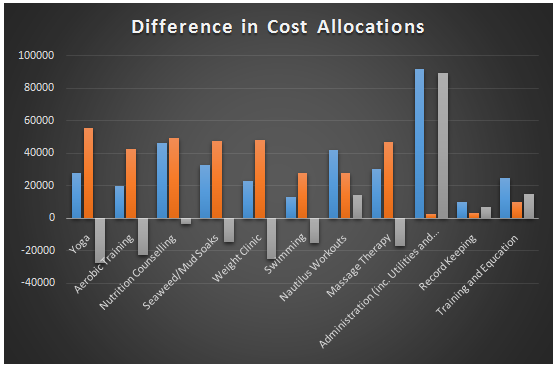
Appendix-3: Factors Causing Deficit
Chart-3.1
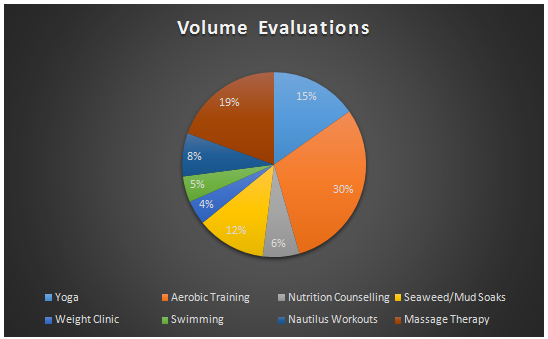
Chart-3.2
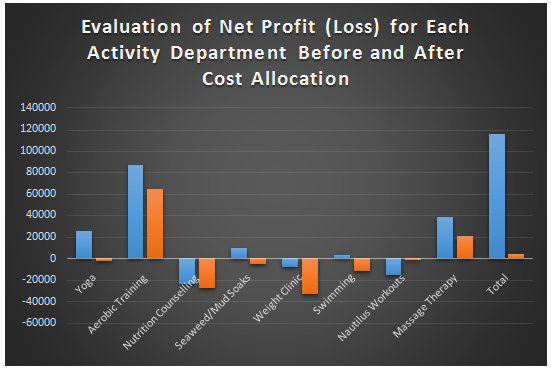
Chart-3.3
Appendix-4: Pricing Strategy
| Pricing Strategy | |||
| Activity | Price Charged | Price to be Charged | Comments |
| Yoga | 10.7 | 11.70 | Increased |
| Aerobic Training | 10.7 | 4.45 | Decreased |
| Nutrition Counselling | 10.7 | 24.77 | Increased |
| Seaweed/Mud Soaks | 10.7 | 12.50 | Increased |
| Weight Clinic | 10.7 | 36.27 | Increased |
| Swimming | 10.7 | 19.62 | Increased |
| Nautilus Workouts | 10.7 | 11.65 | Increased |
| Massage Therapy | 10.7 | 7.71 | Decreased |
| Average Price Suggested | 16.08 | ||
Appendix-5: Projected Income Statement
| Projected Income Statement | ||||||
| Average Price (Previous) | Average Price (Suggested) | Price per Department (Suggested) | ||||
| Revenues from Client’s Fees | 385495 | 582102 | 400095 | |||
| Other Revenues | 0 | 385495 | 0 | 582102 | 0 | 400095 |
| Expenses: | ||||||
| Program Services | 381042 | 381042 | 381042 | |||
| Training and Education | 10841 | 10841 | 10841 | |||
| General and Administrative | 6316 | 398200 | 6316 | 398200 | 6316 | 398200 |
| Net Income (Net Loss) | -12705 | 183902 | 1895 | |||
| Profit Margin | -3% | 32% | 0.47% | |||
This is just a sample partical work. Please place the order on the website to get your own originally done case solution.
How We Work?
Just email us your case materials and instructions to order@thecasesolutions.com and confirm your order by making the payment here
Related Case Solutions & Analyses:
 Reciclare: Rethinking the Future
 mySmoothie: The Swedish Fruit Invasion
 Mittal Steel: The Making of the Worlds Largest Steel Company (B)
 Fox Bids for the NFL–1993
 NTT DoCoMo 2003
 Note on Operating Exposure to Exchange-Rate Changes
 Competing Through Business Models: Introductory Note for Students, Course Overview


