Blaine Kitchenware, Inc.: Capital Structure Case Study Solution
Decrease in Share Price:
Another major cost that the Blaine Inc. could face is the decrease in its share price. It could be seen that the company’s shares were highly priced in the stock market despite of the low ROE and a low annual compounded rate of return on shares. The major reasons behind this is the capital structure of the company with no debt and a highly liquid position. However, the incorporation of debt in the capital structure could hurt the company’s position in the stock market and reduce the share price of the company. However, utilization of the debt in stock repurchase would compensate the losses and result in increasing returns for shareholders. (Brigham, 2016)
Costs of Financial Distress before the Stock Repurchase
The costs of financial distress faced by the company before the stock repurchase include the low ROE i.e. 11% as compared to a men ROE of 25% of the peers in the industry. Moreover, another financial distress faced by the company is low annual compound rate of return on shares i.e. 11% greater than industry but less than the peers i.e. 16%. Along with it, low dividend per share i.e. $1.07 despite of increasing payout ratio is also one of the financial distresses faced by the company.
Changes in Financial Metrics after Stock Repurchase and Leverage
However, all of these financial costs could be altered by incorporating debt in the capital structure and repurchasing stocks. A table showing the comparison of various financial metrics before and after the SR and leverage is given in the Appendix 4.
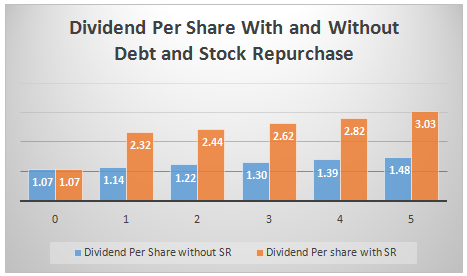
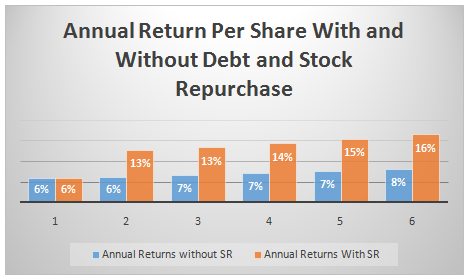
It could be seen from Appendix 4 that the dividend per share with SR and debt are higher than the dividends without SR and Debt. Moreover, the compound annual rate of returns on stocks with SR and debt are also higher than the rate of returns without SR and debt. Moreover, the company could provide a rate of return of 16% at the end of the 5th year that is equals to the rate of return provided by its peers. Along with it, the ROE in case of SR and leverage is also high i.e. 18% as compared to an average ROE of approximately 11% without SR and debt.
Conclusion
Although, the incorporation of debt in the capital structure could bring certain challenges for the company as it tends to decrease the company’s credit rating in the market, negative impact on the stock market position of the company, but, the major problems faced by the company including the low ROE, low annual compound rate of return on stocks, low dividend per share could be resolved by acquiring debt and using the amount of debt and the cash available to repurchase the stocks.
Appendices
Appendix-1: Blaine Kitchenware, Inc. Income Statement (With Interest)
| Blaine Kitchenware, Inc. Pro-forma Income Statement (in 000s of dollars) (with Interest) | ||||||
| Actual | Projected | |||||
| 0 | 1 | 2 | 3 | 4 | 5 | |
| Revenue | 346,336 | 369231 | 393641 | 419663 | 447406 | 476983 |
| Less: Cost of Goods Sold | 249,794 | 266307 | 283912 | 302681 | 322691 | 344023 |
| Gross Profit | 96,572 | 102924 | 109728 | 116982 | 124716 | 132960 |
| Less: Selling, General & Administrative | 28,512 | 30397 | 32406 | 34549 | 36833 | 39267 |
| EBIT | 68,060 | 72527 | 77322 | 82434 | 87883 | 93693 |
| Interest Expense | 0 | 3,375 | 3,128 | 2,864 | 2,582 | 2,282 |
| EBT | 68,060 | 69152 | 74194 | 79570 | 85301 | 91411 |
| Taxes | 23,821 | 24203 | 27063 | 28852 | 30759 | 32792 |
| Tax rate | 35% | 35% | 35% | 35% | 35% | 35% |
| Net Income | 44,239 | 44949 | 47131 | 50718 | 54542 | 58619 |
Appendix-2: Blaine Kitchenware, Inc. Income Statement (With SR)
| Blaine Kitchenware, Inc. Pro-forma Balance Sheet (in 000s of dollars) (with SR) | ||||||
| Actual | Projected | |||||
| 0 | 1 | 2 | 3 | 4 | 5 | |
| Assets: | ||||||
| Cash | 230866 | 34353 | 47377 | 61426 | 76567 | 92872 |
| Other Assets | 257497 | 257497 | 257497 | 257497 | 257497 | 257497 |
| Treasury Stock | 259000 | 259000 | 259000 | 259000 | 259000 | |
| Total Assets | 488363 | 550850 | 563874 | 577923 | 593064 | 609369 |
| Liabilities and Equities: | ||||||
| Debt | 0 | 46338 | 42429 | 38256 | 33802 | 29047 |
| Equity | 488363 | 504512 | 521445 | 539667 | 559262 | 580323 |
| Total Liabilities and Equities | 488363 | 550850 | 563874 | 577923 | 593064 | 609369 |
Appendix-3: Dividend Analysis
Appendix-4: Financial Performance With and Without Stock Repurchase and Leverage
| Comparison of Financials Before and After Stock Repurchase Leverage | |||||
| Year | 1 | 2 | 3 | 4 | 5 |
| Dividend Per Share | |||||
| Without SR | 1.14 | 1.22 | 1.30 | 1.39 | 1.48 |
| With SR | 2.32 | 2.44 | 2.62 | 2.82 | 3.03 |
| Annual Return On Share | |||||
| Without SR | 6% | 7% | 7% | 7% | 8% |
| With SR | 13% | 13% | 14% | 15% | 16% |
| ROE | |||||
| Without SR | 9% | 10% | 10% | 11% | 12% |
| With SR | 18% | 18% | 18% | 18% | 18% |
| Operating Cash Flows | |||||
| Without SR | 44,239 | 47,143 | 50,259 | 53,582 | 57,124 |
| With SR | 47,143 | 50,259 | 53,582 | 57,124 | 60,900 |
This is just a sample partical work. Please place the order on the website to get your own originally done case solution.